One of my earlier and wonkier posts on this blog was a way to score China’s provinces by the relative size of their state-owned enterprise sector. While anyone who has been to China can tell that some places are more state-dominated than others, the goal was to add some discipline to those kind of impressions. The underlying data for that exercise was a bit patchy, so I’ve updated the scores with more consistent data for 2015.
Below are the results; there’s not a huge amount of change, so I thought it would be more interesting to present the actual scores rather than a map (there’s one in the previous post). The score is computed by standardizing and summing the SOE share of fixed-asset investment, the SOE share of industrial sales, and the ratio of local SOE assets to GDP; the underlying data comes from Chinese statistical yearbooks.
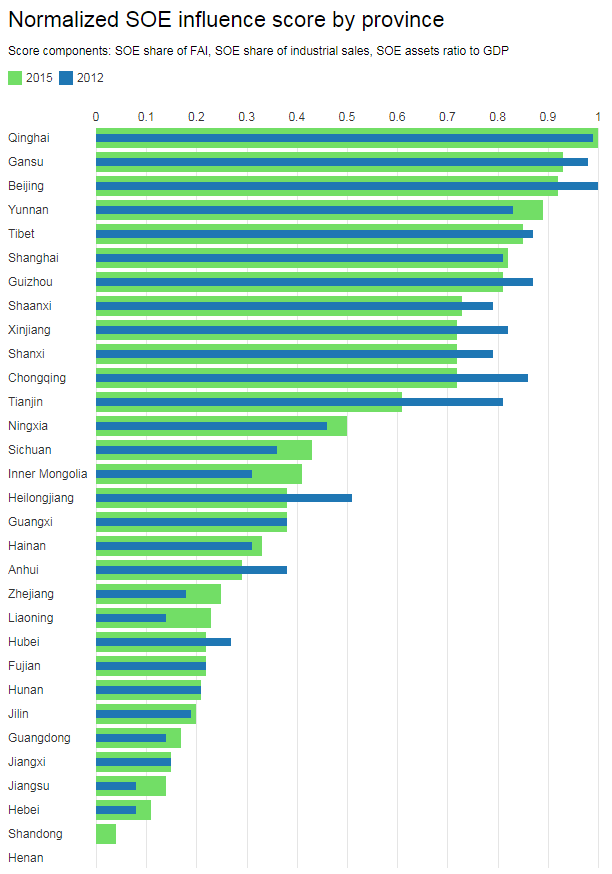
Note that these are relative scores not absolute ones–the highest-scoring province gets a 1, which doesn’t mean the provincial economy is 100% state-dominated. A few interesting things to point out:
- The poor western provinces have by far the most state-dominated economies. In part this is because their economies are small, in part it is because SOEs are one of the main channels through which regional redistribution happens in China. Poor western provinces get more state-sponsored infrastructure and investment projects. For instance, in Tibet 76% of fixed-asset investment spending is by SOEs, compared to a national average of around 32%.
- The four provincial-level municipalities, Beijing, Shanghai, Tianjin, Chongqing, also have very high levels of SOE activity. Beijing in particular stands out with a very high score on all three components, despite the fact that, unlike Gansu or Yunnan, it has very substantial amounts of foreign investment and domestic private-sector activity, particularly in high tech. I think this is not a size effect since the municipalities have economies and populations larger than many provinces. In part I think it reflects their political importance and clout, which means more state activity.
- It’s interesting that the three northeastern provinces have relatively moderate scores despite being generally portrayed as the bastions of state enterprise. My guess is that the northeast has not gotten the kind of infrastructure spending boost that the western provinces have, which is the main thing driving their scores so high. The assets/GDP metric also only covers local-government-controlled SOEs, where the northeast in fact ranks very low; they are home to more central-government-controlled SOEs which are getting missed by this metric. So, the score is not a perfect tool.
- While there’s not a simple correlation between the SOE influence score and income levels or growth rates, it’s nonetheless true that most of the action in the Chinese economy happens in places that are not so state dominated. The four big coastal provinces–Guangdong, Jiangsu, Shandong, Zhejiang–are all at the bottom of the list, and account for a bit more than 25% of China’s GDP. The dozen most state-dominated provinces combined are still smaller than that: the four municipalities account for about 11% of GDP, and the other eight provinces that top the list account for about 10% of GDP.

What’s going on with Henan?
Interesting, right? Perhaps it’s time to reconsider all those anti-Henan prejudices.
On which, by the way, I must recommend this old WSJ article by Matt Pottinger: https://www.wsj.com/articles/SB111377879936309051