This week the last of the provinces reported their GDP data for 2015, so now the full set is available–which means more maps! I’m going to focus on provincial nominal GDP growth here, as the changes are more dramatic, and more interesting, than in real GDP growth. Here’s an example: in 2014, three provinces reported real GDP growth below 6% (Shanxi, Liaoning and Heilongjiang), and three provinces reported real GDP growth above 10.5% (Guizhou, Chongqing and Tibet). In 2015, the same three lagging provinces were the only ones to report real GDP growth below 6%, and the same three leaders were the only ones to report real GDP growth above 10.5%. So, not much change, right?
Not at all. Nominal GDP growth tells a different story, and a more intuitive one: there was a broader and deeper slowdown last year. In 2014, exactly one province had nominal GDP growth below 2%: the coal capital of Shanxi, with 1.3% growth. But in 2015, seven provinces reported nominal GDP growth below 2%: Shanxi again at 0.3%, but also Gansu, Liaoning, Heilongjiang, Xinjiang, Hebei and Inner Mongolia. In Gansu, nominal growth was actually negative, with its GDP declining 0.7%. Similarly, in 2014 there were 10 provinces that reported nominal GDP growth above 10.5%, but in 2015 that number shrank to three. The three remaining fast-growth provinces, again Guizhou, Chongqing and Tibet, have economies that are heavily dependent on government subsidies.

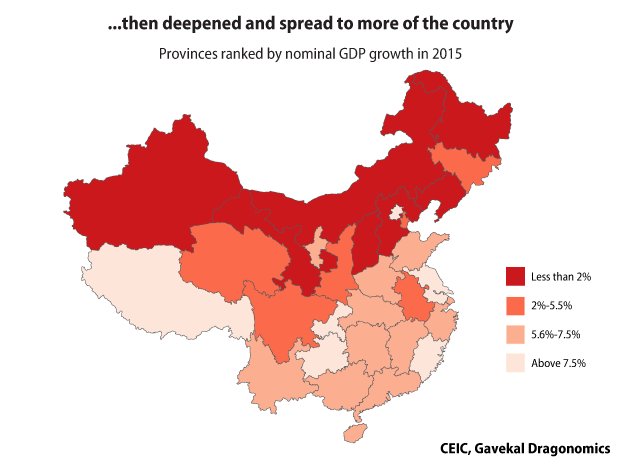
The regional pattern of the slowdown is pretty clear: it is deepest in the heavy-industry-dependent provinces of the north and far west. This fact, and the fact that the slowdown is so much deeper in nominal terms than in real terms, to me reinforces the point that China’s slowdown has its origins in the housing downturn and the knock-on effects in commodity prices.
