Mapping China’s 19th century provincial incomes

A passing reference from the encyclopedic Pseudoerasmus sent me to the work of Paul Caruana-Galizia, who has done an impressive series of papers quantifying historical income levels on a regional (rather than the usual national) basis for many countries.

His paper on China, written with Ye Ma, gives us provincial per-capita GDP for the late 19th and early 20th centuries — an essential resource for comparing patterns of development over a longer time period.

The paper inexplicably does not include a map, so I have made a couple myself:

provincial-per-capita-GDP-1873

provincial-per-capita-GDP-1914

(Note: In these maps, Hebei includes the present-day municipalities of Beijing and Tianjin, Jiangsu includes Shanghai, and Sichuan includes Chongqing.)

The decline of incomes across most provinces (with Jiangsu and Xinjiang notable exceptions) is visually very obvious. Regional inequality was also basically stable over this period, probably reflecting the absence of sustained growth. Here is some useful commentary from the paper for context:

How do these per capita income levels compare with Europe’s? In 1873, Heilongjiang was China’s richest province with a GDP per capita of $870. In 1870 Europe, there were eight regions out of a sample of 200 that had per capita incomes between $800 and $950. Of these eight, five were in Austria-Hungary, one in France (Haut-Garonne), one in Germany (East Prussia), and one in Spain (Extremadura). These comparisons add weight to the argument by Pomeranz that some European areas were at similar levels of development to Asian ones. The fact remains, however, that China’s richest province – some 43 per cent above the Chinese average in 1873 – was only as rich as Europe’s poorest regions. … By the close of the period, Jiangsu surpassed Heilongjiang as the richest Chinese province with an income of $853. The only comparable European region is Dalmatia ($874).

On a macro level, the results corroborate histories of national economic decline and stagnation. China’s mean provincial per capita income compound annual growth rate over the period was −0.20 per cent. The internal disorder and continuous shocks to the economy in the forms of rebellions, foreign wars, and natural disasters meant that most Chinese were better off at the end of the nineteenth century than they were at the start of the twentieth.

Ma and de Jong’s numbers show that Chinese real GDP per capita dropped by 10 per cent from 1873 to 1912. Looking to Europe for comparisons, we see that Italian regions enjoyed an annual growth in per capita income of some 1.2 per cent, similar to that in France. These figures fit with Gernet’s claim that China’s ‘tragic period’ coincided with Europe’s ‘acceleration.’

And here’s the original table for reference:

Caruana-Galizia-table

The historical roots of China’s industrial clusters

I’ve been interested in industrial clusters in China for a while, since I think they tell us a lot about underlying patterns of private-sector economic activity. Clusters are behind much of China’s decades-long success in exports, and more recently seem to be related to some fast-growing domestic service sectors as well.

A recent working paper by Xiwei Zhu et al., “Entrepreneurship and Industrial Clusters: Evidence from the China Industrial Census“,  makes some interesting points on this topic. The authors do some fancy math to identify clusters from data on the location of industrial firms, which results in the nice map below.

Zhu-cluster-map.png

The results are broadly consistent with more anecdotal approaches to identifying: industrial clusters are most prevalent in the coastal provinces of Zhejiang, Jiangsu and Guangdong (but note that Sichuan far inland also does pretty well). Places with lots of clusters also tend to be places where the private sector is a larger part of the economy.

Why do clusters form in these places? Geography is part of the traditional explanation, and the authors do find that access to ports (i.e., access to world markets) contributes to the formation of clusters. But they also argue that what they call the historical “supply of entrepreneurs” is an important factor.

Since there were few recognized private companies in China before the 1990s, most founders of private-sector firms had to come from somewhere else–and state-owned or collective enterprises were a major source.

Zhu-entrepreneur-table.png

The authors use the number of firms in 1985 as an indicator of this historical potential for entrepreneurship. And they find that the number of all firms in 1985 is closely related with the number of private-sector firms in 2004:

Zhu-firms-scatter.png

The pattern suggests that the places where private-sector businesses flourished after liberalization were in fact those places where disguised private-sector businesses were already most prevalent. This fits in with historical evidence from the 1970s that pre-Communist commercial traditions and patterns often continued in the form of collective enterprises.

Though this particular paper is heavy on data and light on historical interpretation, I think it does contribute to a different narrative about China’s economic development. In such a narrative, China’s growth resurgence, at least in the 1980s and 1990s, is more about the flourishing of long-suppressed indigenous entrepreneurial traditions than the success of top-down development programs.

A new variation on the hex grid tile map of China

Many things, blogging and otherwise, to catch up on after a good holiday. First off, I’m overdue in acknowledging a nice use of my proposed hex grid tile map of Chinese provinces by Claire Chang Liu, posted in the comments on the original post. The below is an excerpt from her data visualization project on Chinese migration, with the tile map illustrating the percentage change in each province’s floating population between 2000 and 2010.

Claire-hex-grid

Claire also moves Xinjiang, Qinghai and Tibet down one row compared with my original proposal. Personally I have to say I still like having Xinjiang stick up a bit, it helps maintain the classic chicken-shaped outline of China. But mainly I’m glad the hex tile map is getting a bit of use.

hex-map-simple

Mapping China: The spread of the nominal growth slowdown

This week the last of the provinces reported their GDP data for 2015, so now the full set is available–which means more maps! I’m going to focus on provincial nominal GDP growth here, as the changes are more dramatic, and more interesting, than in real GDP growth. Here’s an example: in 2014, three provinces reported real GDP growth below 6% (Shanxi, Liaoning and Heilongjiang), and three provinces reported real GDP growth above 10.5% (Guizhou, Chongqing and Tibet). In 2015, the same three lagging provinces were the only ones to report real GDP growth below 6%, and the same three leaders were the only ones to report real GDP growth above 10.5%. So, not much change, right?

Not at all. Nominal GDP growth tells a different story, and a more intuitive one: there was a broader and deeper slowdown last year. In 2014, exactly one province had nominal GDP growth below 2%: the coal capital of Shanxi, with 1.3% growth. But in 2015, seven provinces reported nominal GDP growth below 2%: Shanxi again at 0.3%, but also Gansu, Liaoning, Heilongjiang, Xinjiang, Hebei and Inner Mongolia. In Gansu, nominal growth was actually negative, with its GDP declining 0.7%. Similarly, in 2014 there were 10 provinces that reported nominal GDP growth above 10.5%, but in 2015 that number shrank to three. The three remaining fast-growth provinces, again Guizhou, Chongqing and Tibet, have economies that are heavily dependent on government subsidies.

2014-nominal-growth

2015-nominal-growth

The regional pattern of the slowdown is pretty clear: it is deepest in the heavy-industry-dependent provinces of the north and far west. This fact, and the fact that the slowdown is so much deeper in nominal terms than in real terms, to me reinforces the point that China’s slowdown has its origins in the housing downturn and the knock-on effects in commodity prices.

Mapping China: The Soviet influence in the 1950s

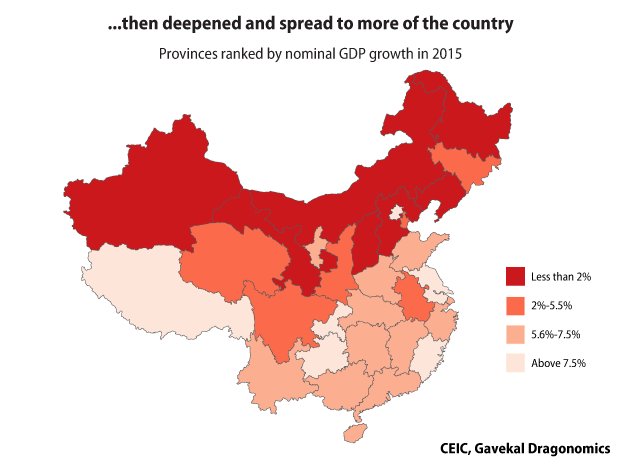
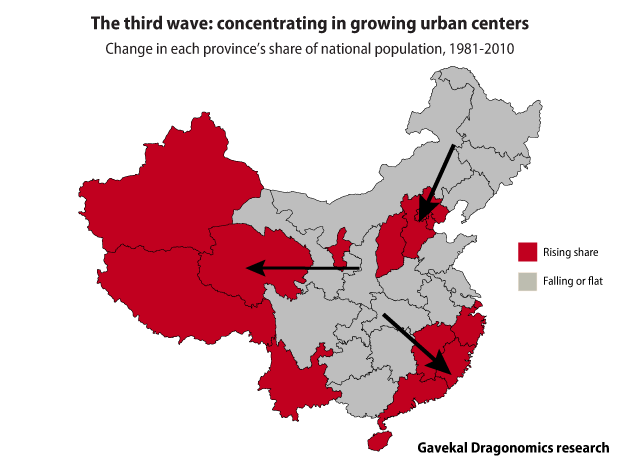
How far back do the current economic problems of some Chinese provinces go? To a large extent the current downturn looks mainly resource-related, a result of the intense slowdown in housing construction. But it is also hard to avoid noticing that many of the places that are doing poorly have historical legacies that could be, shall we say, problematic. The three northeastern provinces, which were the cradle of state-owned industry in the 1950s and have been receiving heavy government support for decades, have been among the worst performing of all. Here are some interesting comments from Li Pumin of the National Development and Reform Commission, at a press conference on the Northeast in August 2015, which convey some of the flavor of the political discussion about the Northeast (my translation):

The General Secretary [Xi Jinping] in July and the Premier [Li Keqiang] in April each made inspection tours of the Northeast, and also held forums. This shows that Party Central and the State Council attach great importance to the revitalization of the Northeast. Why is it so important? …The Northeast was the first part of our country to be liberated, and it also has the best industrial base. During the First Five-Year Plan period when the Soviet Union helped build 156 projects, 58 of them were in the Northeast, or one-third of the total. This formed a large group of backbone enterprises in resources, energy, equipment manufacturing and national defense. As the “first born” of the People’s Republic, the Northeast made great contributions to building our country’s industrial system and the whole national economy. The comrades here today are perhaps rather young, but if you ask the older generation [they will tell you that] in the 1960s and 1970s, the Northeast produced a lot of equipment, technical information and personnel that supported the development of the mainland. …Also at that time the Northeast made other contributions, producing much oil, grain and timber to support China’s economic construction in the early days after Liberation. It should be said that as the “eldest son” of the People’s Republic, the Northeast has made great contributions, so the People’s Republic will not forget this during the current difficulties. This is the historical perspective.

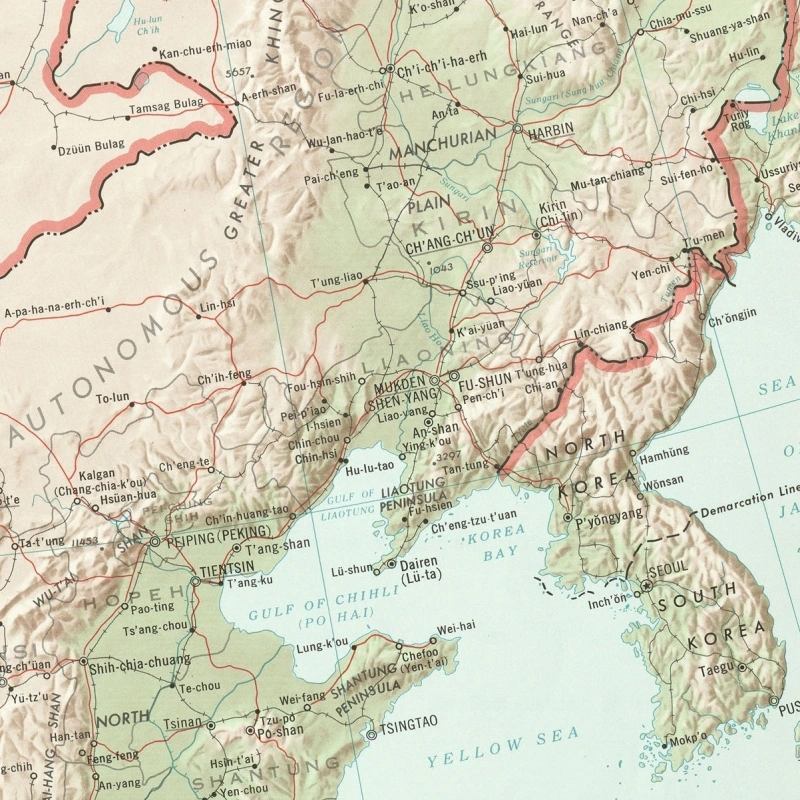
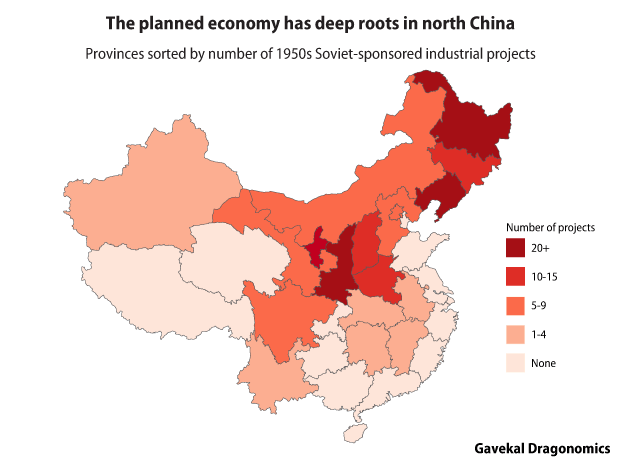
Li’s mention of the Soviet projects in the 1950s piqued my interest–some possible data to work with! It was in fact not too hard to dig up a complete list of the projects, and from that make a few observations (there are a few lists on the internet, but I also confirmed these with printed sources). Indeed, the Northeast (aka Manchuria) received the lion’s share of the Soviet projects. These were the flagship projects of the early days of the planned economy, as China worked hand-in-hand with Soviet experts to replicate their model–which at the time, in the afterglow of the Allied victory in WWII, was seen as quite successful.

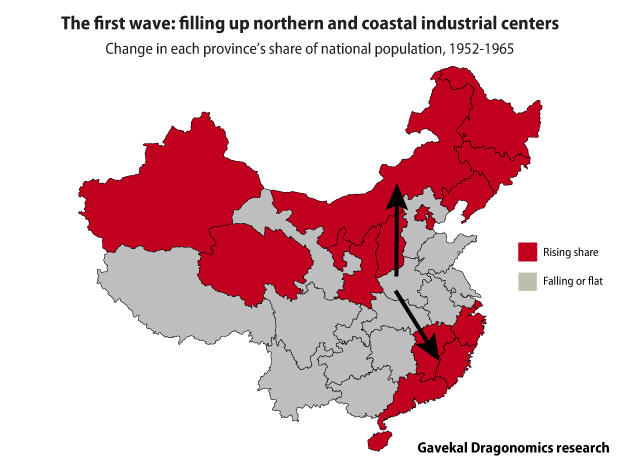
The bias toward the Northeast was perhaps even more dramatic than Li’s comments indicate. Many defense-related projects were built in two inland provinces, Shanxi and Shaanxi (Xi’an today is still one of the centers of China’s state-run aerospace industry). But civilian projects, mostly in heavy industry, were focused on the Northeast, which got 50 out of 106 projects (see the table below). The rest were mostly scattered around northern and inland China. What is remarkable about the map below is that not a single province on the southern or eastern coastal province was chosen as the site of a Soviet project in the 1950s. This is a clear sign how Mao and China’s early planners wanted to narrow the gap between the coast and the inland by channeling resources to the interior (keeping the defense industry far from potential attack was also part of the strategy.)

1950s-Soviet-project

The northern bias of the early planned economy does seems to explain something about China today–anyone who has traveled around the country can attest to the obvious differences between north and south. Try doing a simple “billboard test”: the billboards beside airport highways in the north advertise giant state-owned enterprises; down in Guangdong and Zhejiang, they advertise private firms and trade fairs. The flavor of urban life is also very different, with more small businesses, more variety in domestic brands and more vibrant shopping streets in the south.

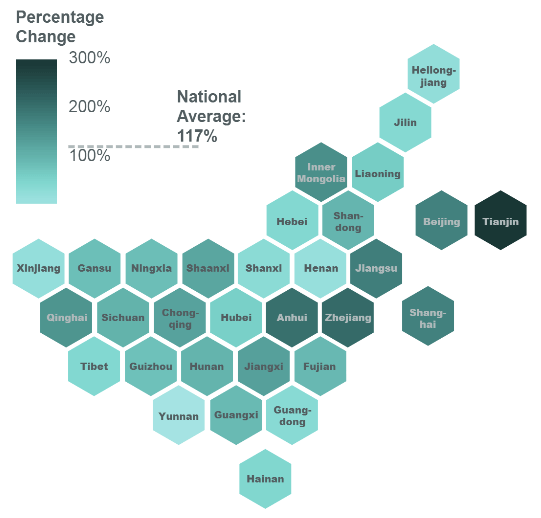
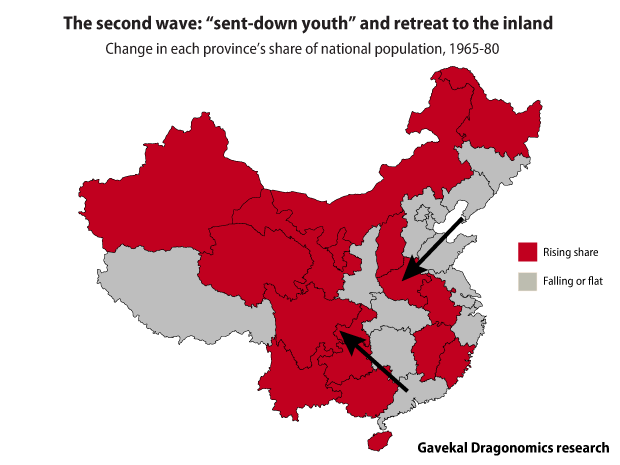
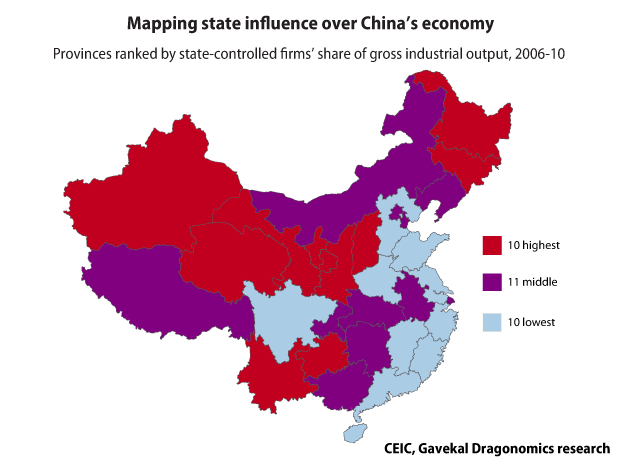
On the other hand, I haven’t been able to come up with a very strong quantitative relationship. There is a positive but pretty weak correlation between the number of Soviet projects a province had in the 1950s and the size of its state sector today, really nothing to write home about. As my index of the influence of state-owned enterprises shows, the provinces where the state sector dominates most are the giant cities of Beijing and Shanghai, and the more remote western provinces that depend mainly on government projects. While the regional policy of the 1950s focused on channeling resources to the north and the northeast, in more recent decades the west has been the favored recipient–and China in the 1990s had a lot more resources to work with than it did in the 1950s. The Soviet-style planning of the early 1950s laid down one regional pattern, but the Soviet model fell out of favor in the 1960s, and subsequent decades had different priorities. So today’s regional pattern is really an overlay of different influences at different times.

So going back to the question I asked at the beginning: do the roots of today’s problems go all the way back to the 1950s? On the data I have now, it would be rash to say that the Northeastern provinces were condemned to have a recession in the 2010s because the Soviets built a lot of factories there in the 1950s. On the other hand, I cannot say that these two facts are completely unrelated. I’m still trying to tease out exactly how they are connected.


Appendix. Here’s the complete regional breakdown of the Soviet assistance projects, most of which took place during 1952-60. Manchuria is in bold.

Province No. of civilian projects No. of defense projects Total no. of projects
Liaoning 20 4 24
Heilongjiang 20 2 22
Jilin 10   10
Henan 9 1 10
Shaanxi 7 16 23
Shanxi 7 7 14
Gansu 7 1 8
Hebei 5   5
Yunnan 4   4
Inner Mongolia 3 2 5
Hubei 3 1 4
Jiangxi 3 1 4
Hunan 3   3
Sichuan 2 4 6
Beijing 1 4 5
Anhui 1   1
Xinjiang 1   1
Grand Total 106 43 149

(Note to nitpickers: yes, my table only shows 149 projects, rather than the 156 mentioned above. This is because in 1983 the official list of actually completed Soviet projects was revised to 150 from 156; one of those was a defense-related project that, for unexplained reasons, was counted as two projects for statistical purposes, and I didn’t bother to adjust for this.)

Mapping China: Which provinces are most dominated by state-owned firms?

The answer I’ve come up with is not quite the one I expected, but it does make sense I think. Beijing is number one, naturally–it’s the place where all the major national state-owned enterprises are headquartered, and SOE influence is inescapable. But after that easy one, anecdotal impressions do not provide much of a guide. According to my scoring system, the provinces where SOEs have the biggest economic weight are the wealthy coastal municipalities, and the far western provinces. In other words, SOEs dominate both the richest and poorest provinces in China, and play a relatively lesser role (though still a large one) everywhere else.

It is interesting that this pattern does not map that well onto the geographic distribution of China’s economic slowdown. Liberals like Sheng Hong of the Unirule Institute argue that the slowdown is caused by the poor performance of SOEs. At least in terms of simple correlations, that does not look to be totally true–indeed the provinces with a high SOE influence score are among those where economic growth has held up relatively better. This is probably because spending by SOEs is one of the main channels the government uses to support growth (it’s the Chinese replacement for countercyclical fiscal policy, which otherwise they don’t do much of).

The provinces where growth has been really terrible are those whose industrial structure is most exposed to the downturn in housing construction, which mainly means places with big mining or steel sectors. Since a lot of mines and steel mills are in fact privately owned, these provinces are actually not as SOE-dominated as some others. I think the poor western provinces have such high SOE influence scores because they do not have much indigenous industry, and are heavily dependent on investment projects funded by the central government and SOEs.

I would not let SOEs are completely off the hook, though it is tricky to disentangle the effects of state ownership and the effects of industrial structure. You could argue (and I probably would) that SOEs tend to make poor investment decisions and thus contributed to excess capacity in the steel and mining sectors, making the slowdown worse. But this argument is complicated by the fact that the provinces with the most resilient, service-driven economies–Beijing and Shanghai–are also incredibly state-dominated. So there’s not a straight correlation between more SOE influence and worse economic outcomes. At first glance, the relative outperformance of services against heavy industry seems to be a bigger effect than the outperformance of private firms against SOEs.

Anyway, food for thought, and further work. And now to the fun part–the map! I use my hex grid map of China in order to show the province names more clearly, and not diminish the importance of the three coastal municipalities which are geographically small but economically large.

hex-map-provincial-SOE-rank-readable

The three indicators I used to compute the SOE economic influence score are: state-owned enterprises’ share of gross industrial output value (as of 2011), state-owned enterprises share of fixed-asset investment (as of 2012) and the ratio of local state-owned enterprises’ assets to provincial GDP (as of 2013). For each indicator I use the most recent data available, but these ratios do not change dramatically over time. I normalized the reading of each indicator and then summed the normalized scores for each province to generate the overall score and ranking.

If I had to pick one indicator out of the three as the most reliable, it would be the SOE share of fixed-asset investment. The SOE share of industrial output (which I mapped previously) does not account for the important role SOEs play in the service sector, which is particularly important in places like Beijing, while the assets of local SOEs would not capture activity by central SOEs which is quite significant in some places. The northeastern provinces, which are generally viewed as having very state-dominated economies, rank very high in terms of the SOE role in industry, but not as high in terms of the broader indicators–which is an interesting corrective to the standard regional prejudice. The complete ranking of the provinces is below:

Top 10   Middle 11   Bottom 10  
Beijing 1 Shaanxi 11 Hunan 22
Qinghai 2 Shanxi 12 Jilin 23
Gansu 3 Heilongjiang 13 Zhejiang 24
Tibet 4 Ningxia 14 Jiangxi 25
Guizhou 5 Guangxi 15 Guangdong 26
Chongqing 6 Anhui 16 Liaoning 27
Yunnan 7 Sichuan 17 Hebei 28
Xinjiang 8 Inner Mongolia 18 Jiangsu 29
Shanghai 9 Hainan 19 Shandong 30
Tianjin 10 Hubei 20 Henan 31
Fujian 21

Coping with industrial decay

Chuin-Wei Yap has an excellent piece in the Wall Street Journal on the shutdown of the Panchenggang steel mill near Chengdu, apparently the largest state-owned steel mill to be closed since the 1950s. The piece is mostly about the human angle, and what happens to “company towns” around China that are centered on declining industries like steel mills or coal mines:

Cities and towns across China are losing some of their biggest employers in a process reminiscent of the factory shutdowns that decades ago hit Rust Belt America, from Detroit to Baltimore.

Paper mills are being forced out of the southern city of Dongguan as it tries to prod manufacturers to move up the value chain. In the northern county of Luquan, made wealthy by cement, scores of polluting producers have shut down as the local government tries to retool the area for tourism; a full-scale replica of the Great Sphinx of Giza—made of cement—stands on the city’s edge.

As communities begin to hollow out, it is straining a social compact that has been a feature of the Communist Party’s rule: that state-owned companies would take care of the industrial workforce, even in difficult times. It is a bargain meant to keep workers from going on strike, or worse, becoming a source of antigovernment unrest, like the dockyard workers who helped bring down Poland’s communist government.

In Qingbaijiang, the industrial district where Panchenggang sits north of Chengdu, thousands of residents have gone elsewhere in search of employment. “For Rent” signs line the streets of once-bustling neighborhoods. Petty crime is edging up.

Read the whole thing, and be sure to check out the spooky video with nice aerial photography of the steel mill and town.

This is a phenomenon we’re only going to hear more about in coming years. It’s not unknown in China currently, but most of the examples I’ve seen of empty “rust belt” towns are in the northeast, and are rare in the rest of the country. As the paragraph above highlights, one of the main ways to deal with local economic decline is for people simply to move. In fact, the northern and inland provinces have been gradually losing population in recent years, at least in relative terms (the national population is still growing, so not that many places have an absolute decline in population).

population-shift-2010-14

Again, this fits the regional pattern of industrial structure and economic distress that I’ve written about several times on this blog: the declining industries are disproportionately located in the inland provinces, particularly north and west. So people have been leaving those places and concentrating in the zones of prosperity with more and better jobs, primarily the Beijing-Tianjin-Hebei area and the southern coastal provinces.

The need to allow people to migrate to help them adjust to the changing economic structure only reinforces the urgency of overhauling China’s household-registration system, which creates lots of disincentives for migration by limiting migrants’ access to social services. There was a lot of discussion about this soon after Premier Li Keqiang took office, but little has been heard of late. I suspect this is because the government is not prepared for the big increase in fiscal spending that would be required to equalize treatment.

Bringing the wonders of the hex grid tile map to China

As you may have noticed I have a bit of a thing for maps. I often go out of my way to find a way to present statistics in map form, because it’s fun, and also because I think it’s important to understand regional variation in China (here’s one recent attempt). But that kind of map where different areas are colored in to convey information, known as choropleths to infographics aficionados, has some drawbacks when applied to Chinese provinces. Namely, the size of Chinese provinces varies hugely. A standard map is visually dominated by Xinjiang and Tibet, which happen to have few people and small economies, while the economic powerhouses of Beijing and Shanghai are barely visible.

This is in fact an extreme version of the problem faced when mapping the US, which also has some big empty states and small populous ones. A recent solution adopted by many infographics mavens is to make all the states the same size; the resulting “grid” maps, usually made up of squares, have been the talk of the infrographics community. Recently the folks over at NPR came up with an even cooler solution, which is to use hexagons rather than squares. This allows the resulting layout of tiles to more closely approximate geographic reality and the well-known shape of the US. I quite like it:

npr-hex-tiles


Naturally, this presented a challenge: can this same technique be applied to China? You betcha. After some playing around I came up with the following solution, which preserves both the chicken-shaped outline of China, and is reasonably accurate about the positions of individual provinces relative to each other. The biggest compromise with reality I made was to pull off the coastal municipalities (Beijing, Tianjin, Shanghai) from the main part of the map. This makes it easier to get the relative positions of the remaining provinces correct.

hex-map-simple

I’m pretty pleased with this (though suggestions for improvement are naturally welcome). Now for the test: does the hexagon tile map work better at presenting information visually? Here’s a map I produced earlier this year, which highlights the regional variation in economic growth across China.

2015Q1-provincial-GDP-tradmap

And here’s the same statistical information presented in a hex tile grid map.

2015Q1-provincial-GDP-hexmap

The differences are interesting. The traditional map presentation works quite nice visually, because the big swath of the slow-growing black and red provinces across the north half of the country conveys a daunting impression. The hex map, as intended, lessens the visual impact of the large but less-important western provinces, and makes it clearer what is happening in the municipalities. It also makes it easier to see how many provinces are growing slowly versus how many are growing more quickly (and has the added benefit of being able to fit in province names, which is hard to do legibly on a regular map). It’s a bit less scary as a result, since you can see that there are still more fast-growing ones than slow-growing ones. So it seems like the hex map is best for illustrating data where the important point is the number of provinces meeting various criteria. I’m not sure for this particular example I would prefer the hex map, but it was certainly fun to explore.

Mapping China: Six decades of population flows

One of my recent side interests has been getting an understanding of how China’s population flows in recent decades relate to patterns further back in history. Mass migration has been a feature of Chinese history long before recent years’ headlines about migrant workers and urbanization. One example is the huge movement of people into Manchuria in the late 19th and early 20th century, which was in terms of the absolute number of people comparable to movement of people into the western United States from 1880-1950, and larger than the emigration from Ireland in the 19th century (according to statistics from Thomas Gottschang’s 1987 article; JSTOR link). After the founding of the People’s Republic in 1949, central planning and political campaigns also had big effects on the movement of people. Examples here are the heavy-industrialization drive of the 1950s, or the “sent-down youth” phenomenon of the 1960s, when millions of students were shipped from urban centers to more isolated provinces.

To try to give myself a way to better understand and visualize all this history, I went through a fairly simple exercise. I put together a spreadsheet of population by province going back to the 1950s from various Chinese statistical yearbooks. Then I looked at which provinces had a rising or falling share of population over time. If the natural rate of population growth does not vary too much from province to province, then a rising or falling share of national population should be a result of net in- or out-migration. The maps below are the result; they depict three big eras in Chinese population flows over the past six decades. The results are obviously sensitive to the periods chosen, which probably could be refined. I also ended up treating the entire reform era (post-1980) as one period as differences among the three decades were not great. (The arrows are just to help clarify the trend, and do not actually indicate the source and destination of migration flows–the data do not permit such precision.)

Hopefully the maps should mostly speak for themselves, but the shift in the direction of population flows over time is quite striking. The first years of Communist rule led to big flows of people into old and new industrial centers in north China and the Pearl and Yangtze River deltas. Some of those movements were then reversed in the chaos of the 1960s, which saw the coastal provinces lose people to a belt of inland provinces. With the reform era the influence of political campaigns declined, and the market forces helped draw people to growing urban centers where higher wages could be earned. The formation of big urban concentrations around Beijing, Shanghai and Guangzhou/Shenzhen is clearly visible in the map. Some regional patterns persist throughout the three periods, notably the net migration into Xinjiang and other western provinces, as well as the island of Hainan, which were places that were relatively lightly populated. I’m sure there is more to learn here, but I have to say these initial results are quite pleasing.

population-shift-1952-65


population-shift-1965-80


population-shift-1981-2010

Mapping China: base and superstructure

A very interesting new paper from MIT, entitled “China’s Ideological Spectrum,” has been making the rounds over the last few days. It uses some unique survey data to show what some basic political terms mean in practice in China. The paper identifies the “core ideological divide” among Chinese people as between left-conservatives (authoritarian government, socialist economics, traditional social values) and right-liberals (constitutional politics, market economics, individual rights). The authors find that support for left-conservative views is highly correlated; in other words, that people who look with nostalgia upon the planned economy also tend to have traditional social values and support authoritarian government, while those who favor, for instance, gay rights also tend to support more market-based economics and democratic politics. This pattern is quite different from the contemporary West, where many people are both economically conservative and socially liberal, or vice versa. (Another key point is that conservatives in China are considered to be left, while liberals are considered right–the opposite of the American usage, though sensible since what Chinese conservatives want to conserve is in fact a leftist system). While the broad conclusions are probably not surprising to those familiar with China, the explanation is clear and the empirical evidence strong and interesting; very much worth reading.

While there are a lot of interesting details in the paper, being a lover of maps I of course immediately looked at the map, which shows the variation in ideology around China. I’ve reproduced it below; the 10 most conservative provinces are colored red, the 10 most liberal blue, and those in the middle purple.

provinces-ideology

The authors run some regressions and find that provinces with more liberal populations also tend to have higher incomes, more openness to trade and higher rates of urbanization. The broad pattern is reasonably intuitive, as are some of the specifics (Tianjin being more conservative than Beijing will surprise no one who has been to both places). But I also wondered, if conservatism means in part support for the state role in the economy, why not also measure its relationship to a state role in the economy? Given that we are talking about a leftist system, a little Marxist analysis seems appropriate: how is the superstructure (ideology) related to the base (economy)? Or to put it a different way, do people whose livelihoods depend on SOEs think more highly of SOEs? Below is my own map of state influence over the economy, color-coded in the same way: red for the 10 most state-dominated provinces are red, blue for the 10 least are blue, and purple for those in the middle.

provinces-SOEs

The indicator I used is state-owned enterprises’ share of gross industrial output. This is not a perfect measure, as it does not include the service sector where many SOEs operate–Beijing’s highly service-driven economy is also heavily state-owned, and if services were included then Beijing would almost certainly be in the 10 highest, rather than in the middle as shown here. But the pattern seems broadly correct: provincial economies are least state-dominated on the eastern coast, more so in the central provinces, and most state-dominated in the old industrial bases and resource-heavy border areas.

This map also lines up pretty well with the ideology map, though there are some interesting divergences. The old industrial bases of Jilin and Heilongjiang in the northeast, which certainly have some of the most state-dominated economies in China (and currently among the worst-performing), register as only moderate in their ideological conservatism. If I had to come up with an explanation for this, it would go something like this: the large role of state enterprises in these provinces has not in fact been a good thing in the last couple of decades. There were mass layoffs and immense social dislocation in the late 1990s as money-losing SOEs were overhauled, and there has been a lot of out-migration to more prosperous regions since then. Northeasterners do tend to be rather socially conservative, but because of their own experiences I suspect they are also unlikely to have the illusion that state-owned enterprises are wonderful things.