Many things, blogging and otherwise, to catch up on after a good holiday. First off, I’m overdue in acknowledging a nice use of my proposed hex grid tile map of Chinese provinces by Claire Chang Liu, posted in the comments on the original post. The below is an excerpt from her data visualization project on Chinese migration, with the tile map illustrating the percentage change in each province’s floating population between 2000 and 2010.
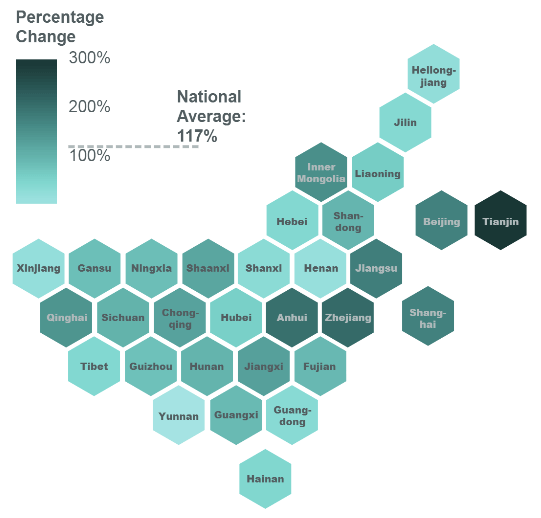
Claire also moves Xinjiang, Qinghai and Tibet down one row compared with my original proposal. Personally I have to say I still like having Xinjiang stick up a bit, it helps maintain the classic chicken-shaped outline of China. But mainly I’m glad the hex tile map is getting a bit of use.


Hi, would you like to share in which software you made the hexmap? it would be very useful. I am trying to create one to be then edited in python. For now, it seems QGIS is a good option altough not super flexible.
Hand drawn in Illustrator! It would be great to have a more automated procedure for making these kind of maps.
Thanks for answer. I did manage to get some hexagons using the center of each province in Python but western provinces are wider so the hexagons are further apart. Anyhow ended up doing the layout in power point and then coloring it with python. Works pretty good