Fear drives industrial policy

Some accounts of the worldwide return of industrial policy treat it as a turn of the tide in the battle of ideas, the victory of a new way of thinking about the best way to manage economies. But it’s clear what has really shifted the position on industrial policy in the US, EU, and elsewhere are security concerns that did not mainly emerge from economic debates.

While it’s customary for people in government to use circumlocutions like competition, challenges, and concerns in public, everyone knows what the real issue is: that the US and China might get into conflict, and if they do that would blow up the global economy. To reduce exposure to that risk, political leaders want national economies to be organized differently than they are now.

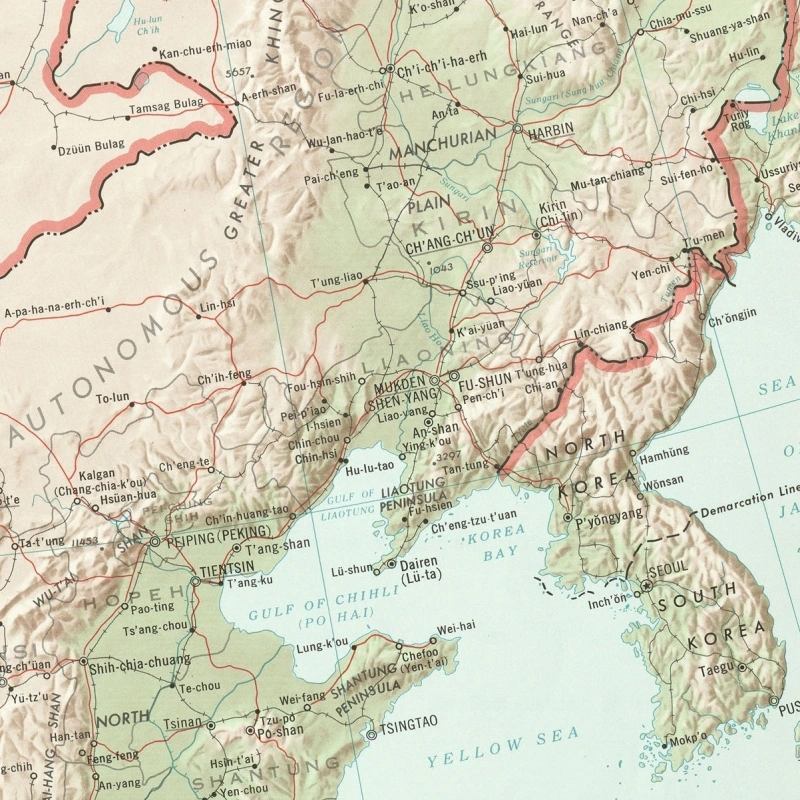
The centrality of security fears was also the pattern in an earlier episode of the emergence of interventionist industrial policy, as I was reminded when I recently stumbled across a 2001 paper, “Threat perception and developmental states in Northeast Asia,” by a Chinese social scientist, Zhu Tianbiao. He argues that the distinctive top-down economic policies of Taiwan and South Korea emerged historically as a response to the threats from mainland China and North Korea respectively. He quotes Park Chung-hee, the Korean general who took power in the 1961 coup and instigated the industrialization drive, as saying: “With a strong enemy across the 38th parallel, this economic struggle takes precedence over combat or politics.”

What I thought was useful about the paper was his suggestion that it is only a particular type of perceived security threat that ends up motivating an industrial policy push. Industrial policy makes sense as a response to a security threat only if the threat is severe enough to require direct government involvement in economic decision-making, and long-term enough so that the resulting economic development will have time to achieve some effects. If the security threat is ambiguous or uncertain, it is hard to achieve the political consensus for a major change in economic policy. And in the case of a severe and immediate security threat, that is to say actual combat, the pushing and prodding of industrial policy would be beside the point: there would be wartime mobilization instead.

Zhu argues that it was only after South Korea and Taiwan emerged from the aftermath of conflict, and the US retreated somewhat from Asia, that their distinctive industrial policy took shape.

US support in both cases made it possible to expect that there would be no immediate war, allowing the leaders of Taiwan and South Korea to think in terms of economic development. At the same time, there was uncertainty associated with US support. It was therefore the combination of expected short-term calm and the uncertainty about long-term outside support that gave rise to the quest for economic independence in Taiwan and South Korea, and made rapid industrialization their top priority.

Similarly, he argues, both Taiwan and South Korea shifted away from highly interventionist policies in the 1980s and 1990s when their security threats became less severe. China under Deng Xiaoping became less threatening: the PLA stopped bombing Taiwan’s outlying islands, and the government started courting Taiwanese investors instead. North Korea did not become less threatening, but the credibility of its threats declined as its economy fell further behind the South; the US also stationed more troops in South Korea and conducted regular exercises.

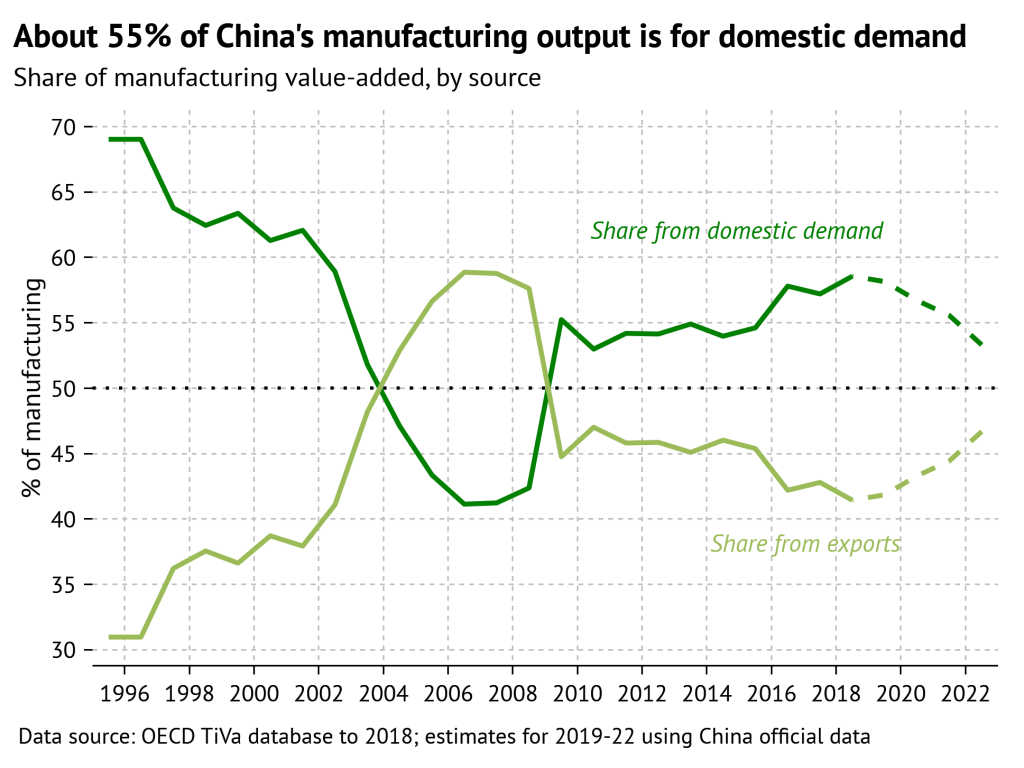
The receding security threats helped open up economic policymaking to different ideas and interest groups. Although China under Mao had a very different response to Cold War-era fears of invasion–the Third Front was much closer to war mobilization–the easing of those security fears also set the stage for its economic liberalization (for more, see my older post China’s security fears and the Cold War economy).

Those historical episodes suggest industrial policy is likely to remain a prominent part of economic policy in Western countries as long as their security fears are elevated. If there’s a silver lining suggested by those precedents, it may be that the focus on industrial policy means governments judge the threat to be severe, but, thankfully, not immediate.

Breaking down China’s manufacturing

I got involved in a Twitter discussion with Brad Setser and others over the nature and causes of China’s high share of global manufacturing. This prompted me to go through some tedious statistical work to establish some basic facts for my own satisfaction. The results are now more or less final, so I am going to outline them here.

We know that China has a high share of manufacturing in its GDP, with the sector’s value-added accounting for about 28% of total value-added at last count. This is higher even than other manufacturing champions like South Korea (25%), Germany (21%) and Japan (20%), let alone the relatively de-industrialized economies like the US (11%), UK (10%), Brazil (12%) and South Africa (13%). Since China is such a large economy, accounting for about 19% of global GDP, its manufacturing sector is also very large relative to the world economy. As of 2021, China accounts for 31% of the world total of manufacturing value-added, according to the UN national accounts database.

Why is China’s manufacturing sector so large? In part, China is making goods for its own use, so its large manufacturing sector reflects the growth in China’s own demand. In part, China is making goods for use by others, so its large manufacturing sector also reflects its success as an exporter. We can start answering the question by quantifying the relative contribution of those two factors.

I did this by using the OECD Trade in Value Added (TiVA) database. Among other things, the database breaks down China’s manufacturing exports by whether the value-added originates domestically or abroad (in the form of imported goods and services used to produce exports). Although there is some change over time, about 80% of the value of manufacturing exports ends up contributing to domestic value-added. Once we know the amount of domestic manufacturing value-added generated by external demand, we know that the rest must be generated by domestic demand.

Doing this simple calculation shows that in recent years, about 40-45% of China’s manufacturing output has come from exports, while 55-60% has come from domestic demand. This pattern was established in 2009 by China’s massive property-and-infrastructure stimulus in response to the 2008 global financial crisis. Since then, the level of investment activity in the economy has stayed very elevated. So we can say that China’s manufacturing sector is indeed mainly oriented to domestic demand, but it’s definitely true that the contribution from exports is quite large. A 55-45 split in an economy of China’s size is a pretty significant reliance on external demand. And that reliance has increased more recently. The current edition of the OECD TiVA database ends in 2018; extending the estimates to 2022 shows that the export contribution has probably picked up quite a bit due to the pandemic export boom.

Nonetheless, China’s manufacturing share of GDP has declined since around 2010, meaning that manufacturing value-added has grown more slowly than the rest of the economy. The value-added breakdown shows that most of that slowdown has come from domestic demand, probably investment. What’s surprising is not so much that China’s investment boom has cooled off from the stimulus-driven peaks after the financial crisis, but that the slowdown has been so gradual. From about 2015-19, a slowdown in exports also contributed to the declining manufacturing share, but the pandemic export boom boosted the external demand contribution again. In a counterfactual world without the pandemic export boom, China’s manufacturing share of GDP would most likely be noticeably lower today.

The breakdown between exports and domestic demand can also be used to shed light on China’s share of global manufacturing (using world manufacturing value-added as the denominator rather than China’s own GDP). This shows a steadily rising trend, meaning that while China’s manufacturing growth did slow down relative to the rest of China’s economy, it continued to be faster than manufacturing growth in the rest of the world. But the drivers of the increase shift over time in ways that reveal the changing patterns of growth.

From 2000-2008, China’s share of global manufacturing rose mostly, though not entirely, because of growth in exports: this was the export boom caused by the mass relocation of manufacturing capacity to China after its WTO entry. Export value-added rose to 8.4% from 2.7% of the global total, while domestic value-added rose to 6.1% from 4.3%. From 2008-2019, export value-added rose further to 11.5%, while domestic value-added rose much more, to 16%. Again, this is the post-financial crisis investment boom. Over 2020-21, export value-added rose to 13.9% while domestic value-added rose to 17.4% (the UN database that supplies the global total of manufacturing value-added hasn’t yet updated to 2022).

Whether China can sustain its pandemic-era gains in exports is obviously an important global macro question. Some of that boost was due to surges in demand in the US and elsewhere that are now retreating. But some of it was due to supply-side developments, like China’s emergence as a major vehicle exporter, that could be more durable. Success on the export front would certainly help support China’s share of global manufacturing and its manufacturing share of GDP. But the crucial factor is really whether China can sustain the super-elevated levels of investment that have driven domestic demand for manufactured goods. Given the unwinding of the property boom and the complete buildout of many forms of infrastructure, this seems increasingly unlikely. Broadly, the fading of the post-crisis investment boom is why I think China’s manufacturing share is probably going to decline again (see my earlier post, “Re-de-industrialization“).

Technical note. Making these calculations using the OECD TiVA database was pretty straightforward. Extending them into more recent years using China official data was a bit tricky. The total for China manufacturing value-added in the TiVA database was basically the same as in the NBS national accounts. However, the value of manufacturing exports is not the same; the TiVA database is built on top of international input-output tables that try to make different countries’ trade figures consistent. Usually, the value of China’s manufacturing exports in TiVA is around 80% of the value of manufacturing exports reported by China Customs. I’m not sure what the reason for this is, but it seems to suggest the headline value of manufacturing exports is overstated. Using the Customs value of manufacturing exports generated a residual for domestic manufacturing demand that was implausibly small, so I adjusted it to be consistent with the TiVA data by using the ratio between the Customs figure and the TiVA figure.