
I got involved in a Twitter discussion with Brad Setser and others over the nature and causes of China’s high share of global manufacturing. This prompted me to go through some tedious statistical work to establish some basic facts for my own satisfaction. The results are now more or less final, so I am going to outline them here.
We know that China has a high share of manufacturing in its GDP, with the sector’s value-added accounting for about 28% of total value-added at last count. This is higher even than other manufacturing champions like South Korea (25%), Germany (21%) and Japan (20%), let alone the relatively de-industrialized economies like the US (11%), UK (10%), Brazil (12%) and South Africa (13%). Since China is such a large economy, accounting for about 19% of global GDP, its manufacturing sector is also very large relative to the world economy. As of 2021, China accounts for 31% of the world total of manufacturing value-added, according to the UN national accounts database.
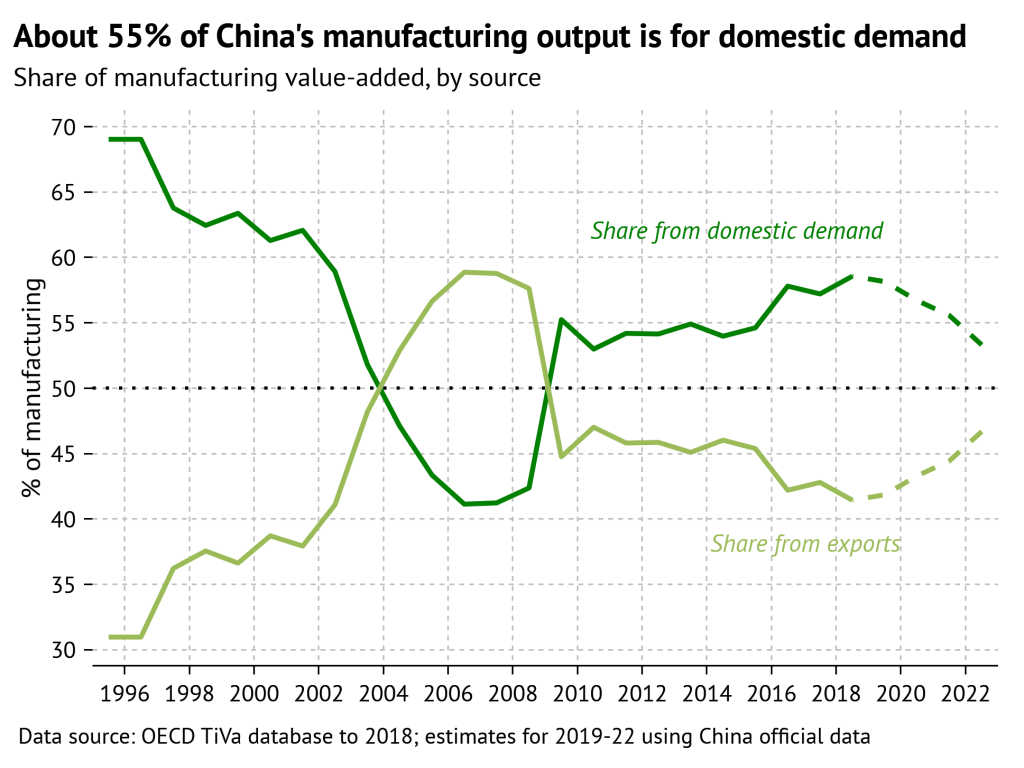
Why is China’s manufacturing sector so large? In part, China is making goods for its own use, so its large manufacturing sector reflects the growth in China’s own demand. In part, China is making goods for use by others, so its large manufacturing sector also reflects its success as an exporter. We can start answering the question by quantifying the relative contribution of those two factors.
I did this by using the OECD Trade in Value Added (TiVA) database. Among other things, the database breaks down China’s manufacturing exports by whether the value-added originates domestically or abroad (in the form of imported goods and services used to produce exports). Although there is some change over time, about 80% of the value of manufacturing exports ends up contributing to domestic value-added. Once we know the amount of domestic manufacturing value-added generated by external demand, we know that the rest must be generated by domestic demand.
Doing this simple calculation shows that in recent years, about 40-45% of China’s manufacturing output has come from exports, while 55-60% has come from domestic demand. This pattern was established in 2009 by China’s massive property-and-infrastructure stimulus in response to the 2008 global financial crisis. Since then, the level of investment activity in the economy has stayed very elevated. So we can say that China’s manufacturing sector is indeed mainly oriented to domestic demand, but it’s definitely true that the contribution from exports is quite large. A 55-45 split in an economy of China’s size is a pretty significant reliance on external demand. And that reliance has increased more recently. The current edition of the OECD TiVA database ends in 2018; extending the estimates to 2022 shows that the export contribution has probably picked up quite a bit due to the pandemic export boom.
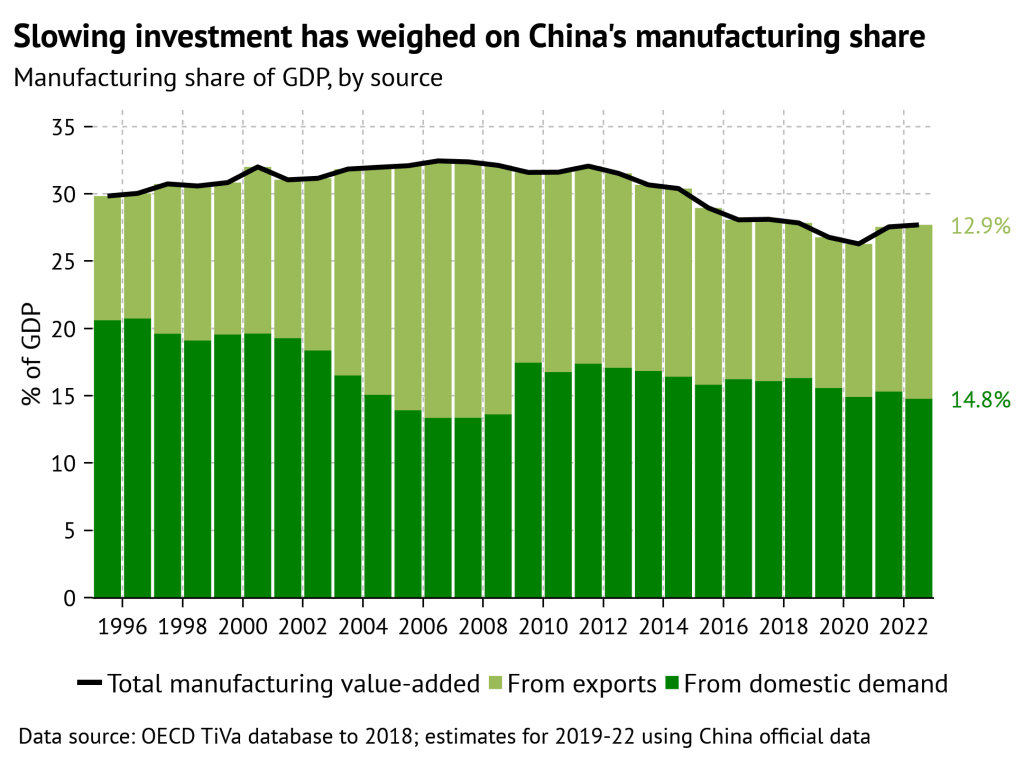
Nonetheless, China’s manufacturing share of GDP has declined since around 2010, meaning that manufacturing value-added has grown more slowly than the rest of the economy. The value-added breakdown shows that most of that slowdown has come from domestic demand, probably investment. What’s surprising is not so much that China’s investment boom has cooled off from the stimulus-driven peaks after the financial crisis, but that the slowdown has been so gradual. From about 2015-19, a slowdown in exports also contributed to the declining manufacturing share, but the pandemic export boom boosted the external demand contribution again. In a counterfactual world without the pandemic export boom, China’s manufacturing share of GDP would most likely be noticeably lower today.
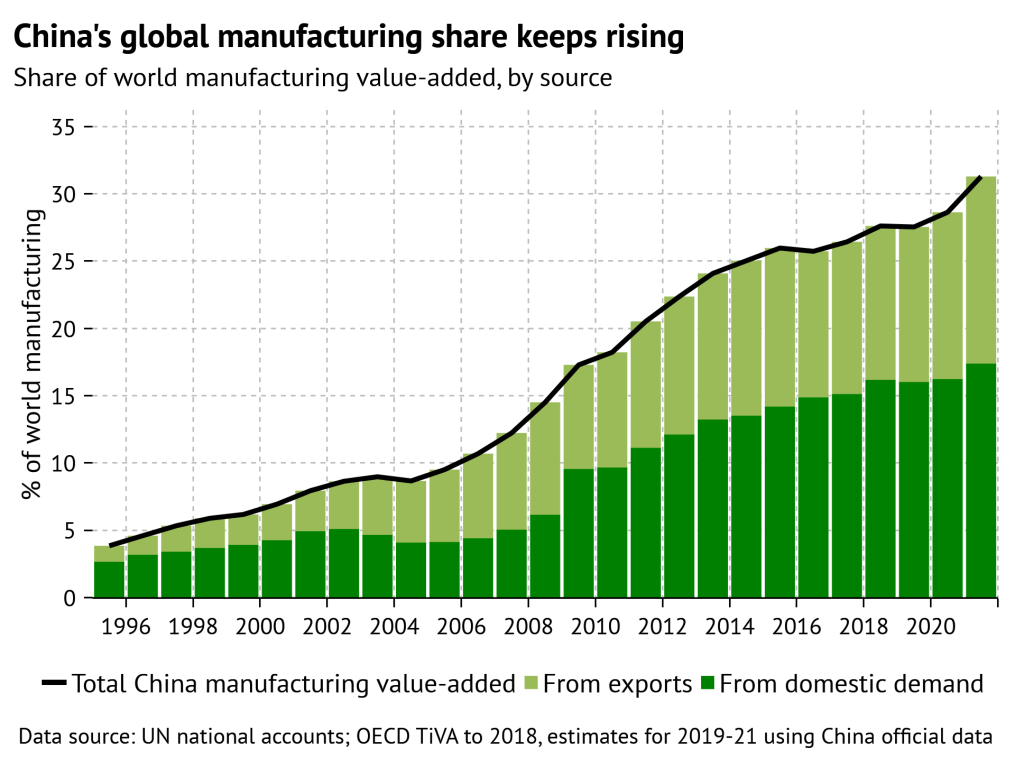
The breakdown between exports and domestic demand can also be used to shed light on China’s share of global manufacturing (using world manufacturing value-added as the denominator rather than China’s own GDP). This shows a steadily rising trend, meaning that while China’s manufacturing growth did slow down relative to the rest of China’s economy, it continued to be faster than manufacturing growth in the rest of the world. But the drivers of the increase shift over time in ways that reveal the changing patterns of growth.
From 2000-2008, China’s share of global manufacturing rose mostly, though not entirely, because of growth in exports: this was the export boom caused by the mass relocation of manufacturing capacity to China after its WTO entry. Export value-added rose to 8.4% from 2.7% of the global total, while domestic value-added rose to 6.1% from 4.3%. From 2008-2019, export value-added rose further to 11.5%, while domestic value-added rose much more, to 16%. Again, this is the post-financial crisis investment boom. Over 2020-21, export value-added rose to 13.9% while domestic value-added rose to 17.4% (the UN database that supplies the global total of manufacturing value-added hasn’t yet updated to 2022).
Whether China can sustain its pandemic-era gains in exports is obviously an important global macro question. Some of that boost was due to surges in demand in the US and elsewhere that are now retreating. But some of it was due to supply-side developments, like China’s emergence as a major vehicle exporter, that could be more durable. Success on the export front would certainly help support China’s share of global manufacturing and its manufacturing share of GDP. But the crucial factor is really whether China can sustain the super-elevated levels of investment that have driven domestic demand for manufactured goods. Given the unwinding of the property boom and the complete buildout of many forms of infrastructure, this seems increasingly unlikely. Broadly, the fading of the post-crisis investment boom is why I think China’s manufacturing share is probably going to decline again (see my earlier post, “Re-de-industrialization“).
Technical note. Making these calculations using the OECD TiVA database was pretty straightforward. Extending them into more recent years using China official data was a bit tricky. The total for China manufacturing value-added in the TiVA database was basically the same as in the NBS national accounts. However, the value of manufacturing exports is not the same; the TiVA database is built on top of international input-output tables that try to make different countries’ trade figures consistent. Usually, the value of China’s manufacturing exports in TiVA is around 80% of the value of manufacturing exports reported by China Customs. I’m not sure what the reason for this is, but it seems to suggest the headline value of manufacturing exports is overstated. Using the Customs value of manufacturing exports generated a residual for domestic manufacturing demand that was implausibly small, so I adjusted it to be consistent with the TiVA data by using the ratio between the Customs figure and the TiVA figure.

I suspect the disparity with customs figures is related to the practicalities of forex controls. There may be incentive to inflate declared export values.