How state ownership came to China

Transitional periods in history are always interesting to me, but they are usually under-researched. It’s easier to find books about how one era or system worked in its heyday then works that discuss the shift from one to another. I’ve always wanted to know more about China’s transition from the chaotic civil war period to the orthodox planned economy of the 1950s, and I’m finding Andrew Walder’s new book China Under Mao: A Revolution Derailed to be a very clearly written analytical history of this period. In line with my interest in all things SOE, the following excerpt is from chapter 4:

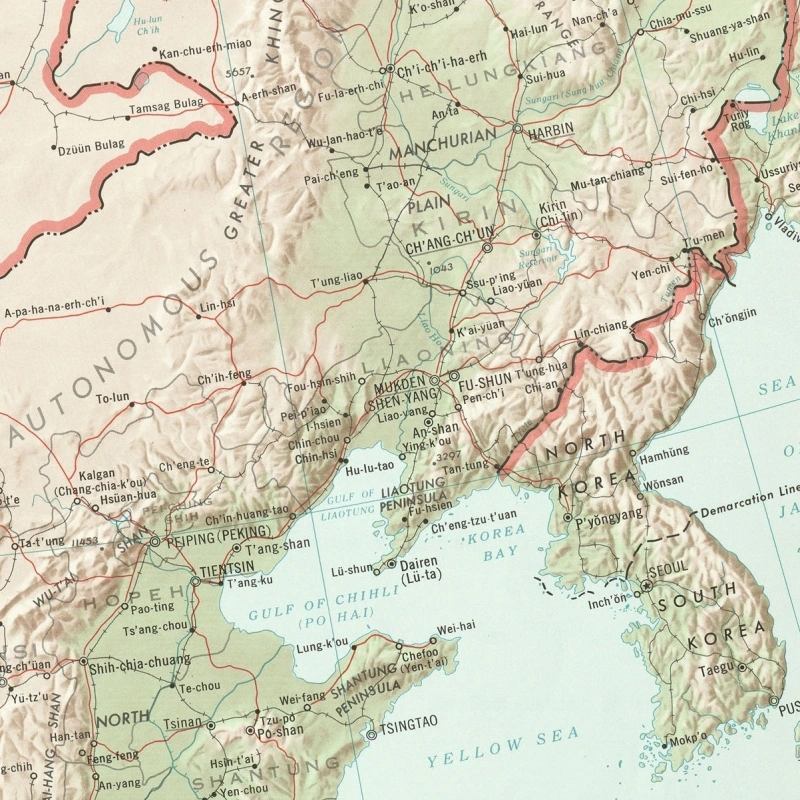
From the late 1920s, the Communist Party’s strategy for revolution focused on rural China. Mao’s early doctrine about class struggle was applied in regions that the party controlled, and as the PLA rolled south and west in its military conquest of China after 1947, CCP cadres orchestrated revolution in villages according to a well-practiced script. The cities, however, were another matter entirely. Not until April 1946 did the party take control of a major city, when they took over Harbin from departing Soviet forces. … Initially, their strategy was to implement military control and leave existing ownership of industry and commerce intact, with the exception of state enterprises controlled by the Nationalists. In the cities, the main emphasis was to stabilize the economy and promote industrial development, not to obliterate the economic foundations of the old society.  …

The urban private sector declined immediately after 1949, even before the party leadership announced its decision to move toward socialism in 1953. Government agencies began to take over banks and wholesale suppliers, making it more difficult for businesses to obtain credit and financing, supplies, and customers. These changes deprived the private sector of the means to compete and grow. … Increasingly, private firms depended on state contracts for their business: the output sold by private firms on state contracts rose from 12 to 56 percent during the same period. … Without any explicit attacks on the private sector, it was gradually being squeezed by state policy and made dependent on state agencies.

The gradual squeezing of the private sector turned into a frontal attack in 1952. The party launched the Three-Anti movement to combat “corruption, waste, and bureaucratism,” and the abuse of power by cadres in urban administrations. The campaign struck civil servants who had stayed in their posts and pledged loyalty to the new regime. … The campaign then pivoted to an attack on private businesses. The Three Anti campaign was merged into a Three Anti, Five Anti campaign. The new claim was that corruption among cadres was caused by the business practices of private entrepreneurs. The new Five Anti targeted “tax evasion, bribery, cheating on government contracts, theft of economic intelligence, and stealing state assets.” Work teams moved into private businesses, demanded to see their accounts, and conducted all-night interrogations that pressured business owners to confess to corruption and tax evasion, reveal the source of their “illegal profits,” and divulge hidden assets. Large fines were levied that bankrupted many businesses, which subsequently closed. Many business owners “voluntarily” turned their firms over to the government as payment for their alleged back taxes and criminal fines.

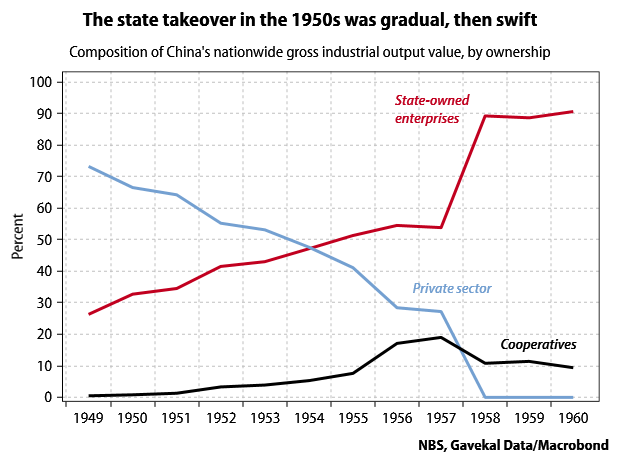
And there’s lots more of interest on other aspects of the creation of the planned economy. Inspired by this reading, I dug up some historical statistics and pulled together the following chart to illustrate the progress of nationalization (the figures in this chart are slightly different from the ones Walder cites in his text, as I’m using a later statistical compilation with revised data). It’s interesting to note that pre-revolutionary China already had a significant amount of state-owned enterprises, as the Nationalists had no aversion to state ownership and made some attempts at planning industrial development (Rana Mitter’s excellent history of the civil war period Forgotten Ally discusses this theme).

abolition of private ownership in 1950s

Further reading: a more detailed account of the early transition to state ownership that Walder cites is Bennis Wai-yip So, “The Policy-Making and Political Economy of the Abolition of Private Ownership in the Early 1950s: Findings from New Material,” a 2002 article in The China Quarterly (JSTOR link).

Is diffusion the answer to the US productivity puzzle?

Few economic debates are as long-running, as intractable, and as beloved of bloggers as that over the pace of technological change and productivity growth. As we all have seen, changing technology has dominated daily life and news headlines in the US to amazing degree in recent years. But these changes are barely evident in the economic statistics on productivity, which should tell us if technology is really raising living standards over the long term. This disconnect between the apparent pace of technological change and our tools for measuring it has led to a huge debate over whether technological progress is “really” slow or “really” fast. A new theory now making the rounds has the potential to shake up some of the entrenched positions in this debate.

Somewhat surprisingly, this new theory comes out of the staid and consensus-loving world of multilateral institutions: the OECD, which recently published an interesting book titled The Future of Productivity. Out in the blogosphere, it has drawn notice from Timothy Taylor and Nick Bunker. Like all good insights, the one in this book is simple. There is no problem with the pace of technological progress, the authors* say: productivity improvements in the most technologically advanced firms are as fast or faster than they have ever been. The reason overall productivity growth is slow is that these improvements are not being adopted as quickly by the rest of the economy. It is a problem of the diffusion of innovation, rather than of innovation itself. Here’s a short quote and the key chart:

The main source of the productivity slowdown is not so much a slowing of innovation by the most globally advanced firms, but rather a slowing of the pace at which innovations spread throughout the economy: a breakdown of the diffusion machine. Indeed, a striking fact to emerge is that the productivity growth of the globally most productive firms remained robust in the 21st century but the gap between those high productivity firms and the rest has risen.

oecd-productivity-spillovers

I find this explanation very intuitively appealing. I also like the way that it moves the debate over productivity back to real empirical phenomena (the adoption of technology), and away from subjective evaluations of recent innovations.  The debate between the techno-optimists and techno-pessimists was never a very satisfying one, because it was so clearly just a static clash of preconceived views (the WSJ’s Tim Aeppel captures it well in his piece on Joel Mokyr and Robert Gordon). The iPhone is amazing, say the optimistists; but it’s not as great as indoor plumbing, say the pessimists. There’s no obvious way to decide between those two statements, so which tribe you supported in the battle was more a matter of emotion and prior disposition than anything else.

The techno-pessimists think the productivity numbers, though not without their problems, are telling us something about the pace of technological progress: it’s slowing down. The techno-optimists prefer to believe their eyes rather than the numbers, and say there are all kinds of reasons why the wonders we see every day might not be showing up in the statistics. The diffusion explanation allows you to believe both your eyes and the numbers: it’s true that amazing things are happening in research labs, but it’s also true that these things are not giving the whole US economy much of a lift.

The diffusion argument also seems like a more satisfying approach than returning to the debate over how well the productivity statistics capture the effect of technological change. This debate was done to death in the 1990s, when the advent of the personal computer similarly failed to ignite nationwide productivity growth–at least, until the IT bubble. While many people in Silicon Valley are now reviving this argument (again this was well covered by Tim Aeppel in a recent piece), the latest iterations offer little that has not been said before. The diffusion argument says, essentially, that Silicon Valley is being measured just fine, but Silicon Valley is not the whole economy–a point which is probably obvious to anyone not in Silicon Valley.

Of course, defining the problem as one of diffusion does not immediately solve the productivity puzzle, since how the diffusion of ideas and technologies works is not well understood. The problem could, for instance, be related to the decades-long slowdown in the pace at which new firms are being created. Though since no one really understands why the startup rate is slowing, it’s not even clear if it is a cause or an effect of the productivity slowdown. But the diffusion argument at least opens up productive (ahem) ways of thinking about the issue. The thesis is clearly linked, for instance, to the ideas of Edmund Phelps, who is worried that innovative activity is too concentrated in a small part of today’s societies, and is much less socially widespread than it was during the 19th century (see his recent piece in the New York Review of Books).

* The authors of the OECD report deserve to be named; they are: Müge Adalet McGowan, Dan Andrews, Chiara Criscuolo and Giuseppe Nicoletti.

The real source of China’s local government money problems

China’s struggles to deal with its mounting burden of local government debt continue to make headlines, giving the dry topic of intergovernmental fiscal relations an unusual amount of relevance these days. The proximate cause of all this local government debt is obvious enough: when the world was falling apart in late 2008, the central government wanted to do a big stimulus, but didn’t want to pay for it. So instead it told local governments to spend whatever they needed on infrastructure to get growth going, and told banks to lend the local governments whatever they needed, and turned a blind eye to any irregularities in all this borrowing. But many scholars and analysts argue that the roots of the problem lie even deeper, that they are the result of a system where there is a fundamental mismatch between the huge burden of public services that local governments have to provide, and the scanty revenues the central government permits them to raise. It’s not just in infrastructure that Beijing pushes the burden down on local governments, the argument goes, but in schools and hospitals and so on. Exhibit 1 in this argument is usually some variant of this chart: Central-local mismatch From these figures, it is easy to get the impression that China’s central government is just rolling in money and not spending any of it–so no wonder local governments have to borrow so much just to make ends meet! Yet this impression is totally false. What is the central government doing with all this revenue? Simple: giving it back to local governments. Of the 6.45 trillion RMB in revenue that the central government collected in 2014, it sent 5.16 trillion back to local governments as transfers (it also spent 2.25 trillion itself, so it was running a deficit). These enormous transfers account for about 60% of total local government revenue, and are the main method by which money is redistributed from richer provinces to poorer ones. If these transfers are treated as what they really are–the main source of local government revenue–then the apparent mismatch disappears: Central-local-mismatch-disappears So while it is fashionable these days to blame excessive centralization of revenues for the mess in Chinese local government finances, this clearly is not a sufficient explanation. Yet it is equally clearly the case that there are real problems in local government finances, and that many localities have to resort to extra-budgetary or extra-legal means to raise money, for infrastructure projects as well as other spending. So how to understand this? As Linda Chelan Li and Zhenjie Yang put the question in a recent article (available for free for a limited time):

The dominant view is that excessive centralization of revenues and decentralization of expenditure responsibilities have precipitated a fiscal crisis in many Chinese counties and townships, with dire consequences to local governance. The ‘gap’ argument emphasizes the relative ratio of central vis-a-vis local revenues and the impact of decentralization of expenditure, and slights the impacts of other parallel fiscal developments, in particular the large flows of central subsidies to local coffers since the 1994 tax sharing reform. As pointed out by the few sceptics, the presence of a large and growing central fiscal subsidy, of a comparable size to the centralized tax revenues, means that logically the latter cannot in itself constitute a sufficient condition for local fiscal difficulties. What then accounts for the difficulties, as localities are not blatantly short of monies?

The answer is that there is not one thing called local government in China: there are multiple levels of local government (at least three). Money does not just have to flow from the central government to local government, but between different levels of local governments. And it is easy to see that this flow might not always be smooth, or that “leakage” may happen along the way as different officials get their hands on the funds. This in fact is the key problem: the central government sends plenty of money to local governments in aggregate, but it does not end up in the right places. The lowest-level governments (counties) are where spending responsibilities are concentrated (see table below), but they are the furthest away from the flow of money from the top. And since responsibility for spending is often assigned without regard to where the revenues come from, mismatches abound. OECD-spending-by-govt-level So the lowest-level governments do in fact have many fiscal obligations and often not enough resources to meet them. The better recent research on China recognizes this more complex reality. Li and Yang’s article demonstrates it through a case-study approach that documents how higher-level local governments undercut those below them, while the OECD’s urban policy review of China has a more data-driven presentation (see pages 189-212). The issue is not that the central government does not give enough money to local governments; it is that the money does not go to the right local governments. As the OECD notes, transfers are often made based on assessments of need that do not match up well with reality:

One of the limitations of the Chinese system is that the need for transfers is assessed mostly based on registered rather than actual population in a province. The problem is that the actual population is generally lower than registered population in low-income provinces, given that migrants remain registered in their home province, regardless of where they live. The government is set to henceforth include 15% of the difference between actual and registered population in the formula for determining transfers. This will partly take into account the cost of migrants to a province.

It’s understandable why the simpler account of a central-local fiscal imbalance dominates the discussion: “the central government has too much money” is a much better slogan than “the fiscal transfer system is suboptimal.” But the first the step in fixing the problem is coming to an accurate diagnosis.

Is food security the untouchable “third rail” of Chinese politics?

One of the most interesting developments in the first year of Xi Jinping’s tenure was his iconoclastic approach to farm policy. He gave a major speech on agriculture in December 2013, in which he outlined a relaxation of China’s policy of maintaining 95% self-sufficiency in grains. As usual for speeches announcing a change in policy, there was much fiery rhetoric about why the old policy was correct: “We cannot look at grain security only from an economic perspective, we must also look at the political perspective,” he said. But in substance what Xi proposed was allowing a higher level of food imports, and focusing efforts at self-sufficiency on only a few crops with sustainable levels of domestic production. (The full text of the speech is not online, but is available in a book of Xi’s speeches, which I’m sure you own.) The new grain security slogans, with included a prominent mention of “appropriate imports,” then made their way into numerous government policy documents.

And then things stopped. As the new line started to get more publicity and public discussion, media coverage and criticism started to mount. The furor got so intense that in February 2014, the Ministry of Agriculture ended up publicly denying that the new slogans meant that China was softening its commitment to grain security. Since relaxing the grain security standard was the whole point of adopting the new slogans, this of course was not really true. But it was significant that the government did not reinforce Xi’s decision to break with past policy, but rather reaffirmed the existing policy. Possibly as a result, there have been no specific measures that actually put into practice the new grain security policy: more than a year and half after the new framework was finalized, there is still no clarity on exactly what level of imports of what products are officially considered acceptable. There have also been possibly retrograde developments, like the new national security law that names grain security as one the key parts of national security. Agricultural economist Cheng Guoqiang summarized the situation in a recent presentation: policymakers remain divided, with some emphasizing the traditional approach to self-sufficiency while others urge change, and there is no consensus on how to move forward.

Why is it important for China to change its approach to grain security? The most obvious reason is that the old one isn’t working: China imports much of its soybean supply, and recently became a net importer of corn (the concept of grain used in China is really a broad category of staples, including beans and potatoes as well as cereals). But as the excellent and indefatigable Dim Sums blog has repeatedly documented, Chinese bureaucrats’ obsession with maintaining high levels of domestic grain output has led to many other problems, like the stockpiling of grain on a vast and wasteful scale, as well as huge overuse of fertilizers and increasing degradation of land. It has also required increasing levels of government subsidy and market intervention to maintain. As the OECD has documented, China has been steadily ramping up subsidies and other farm supports at a time when many other governments have been scaling them back (in absolute terms, China is both the world’s largest agricultural producer and the largest disburser of agriculture subsidies). So in environmental and financial terms, maintaining a high level of self-sufficiency looks increasingly unsustainable–and is only likely to become more so. The chart below shows some model results from Kym Anderson (from an online presentation; here is an ungated version of the supporting paper), arguing that maintaining self-sufficiency in key products will require implausible, and WTO-illegal, levels of tariffs and trade restrictions by 2030.

self-sufficiency-tariffs

Grain security is probably not the most urgent short-term issue Xi Jinping has to deal with right now, so it’s understandable that he may not want to spend much political capital to push through this particular change. But many reformist figures in China view the overhaul of grain security as a key market of progress on Xi’s pledge to give market forces a “decisive role” in the economy. Since Chinese prices for grain are higher than world prices, if market forces play a greater role, then more market forces means more grain imports. Finance minister Lou Jiwei himself, in a now-famous rant about how China can avoid the middle-income trap, named agricultural reform as one of the top economic priorities. “From seed to table, the whole chain has subsidies and interference in resource allocation,” he said at an April forum at Tsinghua University (the Chinese transcript is online; here’s an English write-up). “What should we do? Liberalize prices, preserve crop rotation, give subsidies for fallow land, and import.” Such matter-of-fact acceptance of large food imports breaks is clearly still rare in China. The desire for self-reliance, and the related tendency to see their country as alone in an uncaring world, have deep roots.

Technical note:

How exactly did Xi Jinping propose relaxing the grain security policy? This is a bit hard to explain without resorting to some Chinese terms. The original self-sufficiency policy (laid out in a 1996 white paper) was that net imports of grain were not to exceed 5% of domestic demand. But grain is not just grain; the Chinese term liangshi also includes soybeans and potatoes, among other things. Since China is now a huge importer of soybeans, mostly to make animal feed, this is clearly a big problem for the old policy. Corn (maize) imports are also now growing, and also go mainly into animal feed.

One of the new slogans (谷物基本自给、口粮绝对安全) therefore does away with liangshi, and in its place introduces two new terms: guwu, or cereals, and kouliang, or food grains. There must be “basic self-sufficiency” in cereals (rice, wheat, corn), and “absolute security” in food grains (rice, wheat). Because liangshi is no longer the operative term, the requirement to maintain self-sufficiency in soybeans (and potatoes, for that matter) has been quietly jettisoned. And since corn is subject to the looser “basic” standard, the new policy also means greater tolerance for corn imports. The problem is that there is not yet a definition of what “basic” or “absolute” self-sufficiency might mean in numerical terms, and without that clarity it is hard for officials to know how to actually implement the new policy. The text of the new national security law also refers to the old formulation of grain security in terms of liangshi, further muddying the issue.

Term liangshi (粮食) guwu (谷物) kouliang (口粮)
Usual translation grain cereals food grains (i.e., not feed)
Technical meaning rice, wheat, corn, beans, tubers rice, wheat, corn rice, wheat
Old policy 95% self-sufficiency
New policy “basic self-sufficiency” “absolute security”

Some less desirable consequences of China’s climate-change commitments

The excellent Lucy Hornby at the FT has a good piece pointing out one reason why not everyone is happy with the fact that China is strengthening its commitments to reduce greenhouse gas emissions:

Beijing last week formally submitted its 2030 goals for generating energy from non-fossil fuels, garnering international praise as nations prepare for the Paris climate summit in December. The White House welcomed the announcement, which it said would pave the way for a “successful climate agreement” in France. But the goals cement China’s commitment to another round of dams in southwest, central and far-western China, which would seal the fate of the few remaining free-flowing rivers — some of them sources for vitally important river systems within China and in neighbouring countries. … China’s plan to generate 20 per cent of its power from non-fossil sources by 2030 implies a huge build-out in hydropower dams, nuclear power plants and subsidised wind and solar farms. Installed hydropower capacity is set to rise to 350 gigawatts by 2020, the end of the next five-year plan, compared with 290GW now.

The fact that hydropower development in China now seems to have very strong renewed momentum is interesting. There was actually a period of several years when it looked like a public backlash had slowed development of new large dams. I’ve had an interest in the subject since 2007, when as a WSJ reporter I wrote the following piece after a trip to a disputed dam site in Sichuan:

Seeking to control floods and produce clean energy, China’s central planners have presided over a relentless dam-building drive: The country’s 22,000 large dams represent nearly half the world’s total. But growing numbers of Chinese citizens are criticizing the environmental and social upheaval caused by the structures… Dams have emerged as one of the few legitimate subjects of vigorous public debate, one that’s testing the limits of the public’s role in shaping policy in this authoritarian country. Beyond Dujiangyan, other proposed dams in places like Tibet have been put on hold, or scaled back, after public outcry.

So much for that. A related development is the renewed enthusiasm for building nuclear power plants, another energy source that does not emit carbon dioxide. While nuclear plants haven’t been the same kind of magnet for popular protest that dams have been, there are a few lonely critics who worry that safety and regulation are not keeping up. Which seems like a not unreasonable concern, in a country where “independent regulator” is an oxymoron. Here’s Emma Graham-Harrison in The Guardian back in May:

China’s plans for a rapid expansion of nuclear power plants are “insane” because the country is not investing enough in safety controls, a leading Chinese scientist has warned. Proposals to build plants inland, as China ends a moratorium on new generators imposed after the Fukushima disaster in March 2011, are particularly risky, the physicist He Zuoxiu said, because if there was an accident it could contaminate rivers that hundreds of millions of people rely on for water and taint groundwater supplies to vast swathes of important farmlands.

Bringing the wonders of the hex grid tile map to China

As you may have noticed I have a bit of a thing for maps. I often go out of my way to find a way to present statistics in map form, because it’s fun, and also because I think it’s important to understand regional variation in China (here’s one recent attempt). But that kind of map where different areas are colored in to convey information, known as choropleths to infographics aficionados, has some drawbacks when applied to Chinese provinces. Namely, the size of Chinese provinces varies hugely. A standard map is visually dominated by Xinjiang and Tibet, which happen to have few people and small economies, while the economic powerhouses of Beijing and Shanghai are barely visible.

This is in fact an extreme version of the problem faced when mapping the US, which also has some big empty states and small populous ones. A recent solution adopted by many infographics mavens is to make all the states the same size; the resulting “grid” maps, usually made up of squares, have been the talk of the infrographics community. Recently the folks over at NPR came up with an even cooler solution, which is to use hexagons rather than squares. This allows the resulting layout of tiles to more closely approximate geographic reality and the well-known shape of the US. I quite like it:

npr-hex-tiles


Naturally, this presented a challenge: can this same technique be applied to China? You betcha. After some playing around I came up with the following solution, which preserves both the chicken-shaped outline of China, and is reasonably accurate about the positions of individual provinces relative to each other. The biggest compromise with reality I made was to pull off the coastal municipalities (Beijing, Tianjin, Shanghai) from the main part of the map. This makes it easier to get the relative positions of the remaining provinces correct.

hex-map-simple

I’m pretty pleased with this (though suggestions for improvement are naturally welcome). Now for the test: does the hexagon tile map work better at presenting information visually? Here’s a map I produced earlier this year, which highlights the regional variation in economic growth across China.

2015Q1-provincial-GDP-tradmap

And here’s the same statistical information presented in a hex tile grid map.

2015Q1-provincial-GDP-hexmap

The differences are interesting. The traditional map presentation works quite nice visually, because the big swath of the slow-growing black and red provinces across the north half of the country conveys a daunting impression. The hex map, as intended, lessens the visual impact of the large but less-important western provinces, and makes it clearer what is happening in the municipalities. It also makes it easier to see how many provinces are growing slowly versus how many are growing more quickly (and has the added benefit of being able to fit in province names, which is hard to do legibly on a regular map). It’s a bit less scary as a result, since you can see that there are still more fast-growing ones than slow-growing ones. So it seems like the hex map is best for illustrating data where the important point is the number of provinces meeting various criteria. I’m not sure for this particular example I would prefer the hex map, but it was certainly fun to explore.

Feedback between the stock market and real economy

I have a short post up at the Paulson Institute blog, in response to a question about the impact of the sharp fall in Chinese stock prices. The even shorter version:

If the rising stock market has been supporting the real economy, then that support could well be in the process of unraveling. It’s difficult to find much strong evidence of such support.

Issues considered include the wealth effect, corporate investment, and the surprisingly large contribution of the financial sector to GDP.