Is China’s growth now increasing rather than reducing global inequality?

Here is an interesting tidbit from Branko Milanovic’s latest book, Global Inequality: A New Approach for the Age of Globalization. Much of the book is about the recent, unusual combination of a trend for inequality to rise within countries (as the upper classes take a larger share of each nation’s income) and a trend for inequality between countries to fall (as rising incomes in developing countries narrow the gap between the haves and have-nots on a global basis). China has been the main driver of the latter dynamic, but we may already be at a turning point in that trend–one that will require India to keep growing if global inequality is to keep falling:

Population-weighted intercountry inequality has been uniformly decreasing since the late 1970s, since about the time when China introduced the “[household] responsibility system” (de facto private ownership of land) in rural areas and growth picked up. Moreover, convergence (the decrease in intercountry, population-weighted Gini values) has been remarkable and has accelerated in the first decade of the twenty-first century. We have already seen that this movement was the key factor behind the decrease in global inequality and the broadening of the global middle class. …

China’s role as the main engine driving the reduction in global inequality becomes less important as the country gets richer. In 2011, China’s mean per capita income, calculated from household surveys and expressed in international dollars, was 22 percent below the global mean and was greater than the mean incomes of 49 percent of the people in the world (assumed to have the mean incomes of their countries).

The world will very soon be in the position where China’s high growth rate begins to add to global inequality, not detract from it. India’s mean income is currently ahead of only 7 percent of the world population, and India cannot be expected to “turn the corner,” that is, to become, in average per capita terms, richer than more than 50 percent of the world population, in the next twenty years. Thus it will, if it grows fast, take over from China as the main engine of global income equalization.

The technicalities are interesting and worth citing in full:

Footnote 16: In the case of the Gini coefficient (with which we work here), the point at which a unit begins to add to inequality depends on its rank (let’s call it the “turning point rank”), that is, the number of units from which it has a higher income, but also on the initial Gini. The turning point rank formula is i > ½ (G + 1)( n + 1) which for a large n simplifies to i > ½ (G + 1) n, where i = the turning point rank (the rank i runs from 1 to n), n = total number of units, G = Gini coefficient. Note that the turning point is n/ 2 (i.e., the median) only when the Gini is zero. For the derivation of the formula, see Milanovic (1994).

With the current level of population-weighted global Gini being around 0.54, the turning point rank is 0.77n. That means that China’s mean income has to be such that, when all individuals in the world are ranked by the mean incomes of their countries, 77 percent of the world population is left behind China. But because China’s population is 20 percent of world population, for a Chinese person to be at that (“turning”) point, he or she needs to leave behind only 57 percent (77 − 20) of the world population. Currently, as we have seen, China’s mean income exceeds the mean income of 49 percent of world population. This means that China needs to leave behind just an additional 8 percent of people in the world to begin adding to global population-weighted inequality. This could already be happening by the time this text is being read.


When “It’s the economy, stupid” falls short

I read the news today, oh boy. For some clear thinking if not reassurance, I recommend an essay by Yascha Mounk at Project Syndicate, in which he surveys various people’s takes on the recent global political instability, and comes down fairly hard against the economists’ argument that all this stuff is the result of stagnating incomes. Here is a condensed excerpt, though the whole thing is worth reading:

In what sense are politicians as different as Trump, Erdoğan, and French National Front leader Marine Le Pen connected? Does the anger that has set so many countries’ voters against their political establishment have common causes – and, if so, are there common remedies that can halt the rise of populists? …

According to Bill Emmott, former Editor of The Economist, the reasons are straightforward: “the interests of ordinary people have been subordinated to those of the elite.” … Harvard’s Dani Rodrik agrees, arguing that “the internationalization of markets for goods, services, and capital drives a wedge between the cosmopolitan, professional, skilled groups that are able to take advantage of it and the rest of society.” …

The problem with these explanations is the mismatch between the root causes of popular anger and the form this anger takes in most countries. Supporters of Trump or the Netherlands’ Geert Wilders may blame free-trade agreements for eroding job opportunities; but the bulk of their energy and anger is directed not at prevailing economic orthodoxy, but at social policy. The defining feature of their political brand is hatred of immigrants, not of the World Trade Organization. …

Joschka Fischer, a former foreign minister of Germany, has a more radical view of the economic causes of an essentially cultural rage. He argues that the “White Man’s World” is under attack from the “globalization of labor markets, gender parity, and the legal and social emancipation of sexual minorities.” Immigration is the “issue that brings that prognosis home (not just metaphorically) to today’s angst-inspired nationalists.”

Fischer’s view helps to explain a puzzle identified by Daniel Gros, Director of the Center for European Policy Studies in Brussels. If losses from globalization “account for the rise of populism, they must have somehow intensified in the last few years, with low-skill workers’ circumstances and prospects deteriorating faster vis-à-vis their high-skill counterparts.” But “that simply is not the case,” Gros shows, “especially in Europe.” While the economic transformations of recent decades help to explain falling trust in existing political institutions, it is facile to assume that it is primarily globalization’s immediate losers who support the populists, much less to expect that an upswing in the business cycle will halt the populists’ rise. …

The most optimistic observers emphasize that the costs of globalization stem from politics, not economics. As J. Bradford DeLong of the University of California at Berkeley argues, income stagnation was caused not by globalization, but rather by politicians who have “failed to implement policies to manage globalization’s effects.” … But if such desirable policies exist, why should our political systems, having failed to pursue them in the past, be able to do so now?

In my view, the choices facing us in the next decades may be far starker than the optimists admit. There are three reasons why attempts to shore up living standards are unlikely to stem the populist threat: the right policies might not be adopted; even if they were adopted, they might fail to redress economic grievances sufficiently; and, most important, even if they did redress economic grievances, they would not necessarily defuse the culturally-based anxieties of many citizens. As Harvard’s Ricardo Hausmann emphasizes – and as the Brexit vote clearly showed – the “sense of ‘us’” is more important to many people than achieving greater success through integration with “others.” …

This implies that redistribution and compensation of globalization’s losers will not be enough, and that liberal democracy is likely to become an increasingly unstable political compound.

I find this convincing albeit somewhat depressing. I think it’s pretty clear that the Trump phenomenon is mostly about white identity politics rather than economic issues, and that the Brexit vote was also mostly about English nationalism rather than economic issues. Greg Ip’s recent column has a good summary of research on anti-immigrant sentiment, and how it is in fact driven mainly by national identity rather than economic issues.

The benefit of an economic explanation of the populism/nationalism/whatever thing that is going on in so many different countries is that it can unify what is being explained: all these events are manifestations of the underlying trends in the global economy. I’m don’t find the economic explanations that convincing, but the alternatives are admittedly more complicated. If the working-out of national identity issues is central, as it indeed seems to be, that makes it harder to explain in terms of a cross-country phenomenon.

So I don’t have the unifying field theory for all this, but I do think it’s worth thinking more about how to understand nationalism. One basic conclusion is that politics is not in fact economics by other means, but actually about politics. And there is no more crucial political task than defining the nature and boundaries of the political community. Reflexively looking for the hidden economic interests underlying a political position is a Marxist fallacy if there ever was one–invoking “it’s the economy, stupid” is not always the smart move.

Explaining catch-up growth with China and commodities

The World Bank’s latest Global Economic Prospects report may be a 194-page document, but most of the attention it got was for one little infographic. The Financial Times focused its coverage on the chart, and the Economist also made it one of their charts of the day. As the bank helpfully made the underlying data available, it is easy to reproduce, so here is the original:

World-Bank-EM-catchup

That’s indeed a very nice chart, showing that catch-up growth is not a constant phenomenon, but one that has risen and fallen over the last couple of decades. I like the chart too, but when I first looked at it, I thought: I’ve seen that curve somewhere before. Because I’m interested in regional growth patterns, I have been looking at catch-up growth within China: how quickly have poorer provinces been closing the income gap with the wealthier provinces? (I chose Shanghai as the reference point, since it has been the most developed part of China for many decades.) And when I took my provincial catch-up data and overlaid it with the World Bank’s global data, this is what I got:

catch-up-comparison

I would say those trends are pretty much the same: fewer places experiencing catch-up growth in 1997-2001, a widening of catch-up growth to more places from 2002-2012, and more recently a sharp fall off. So that’s pretty interesting: catch-up growth within China, and catch-up growth across lots of other developing countries, seems to follow the same pattern.

One possibility is that catch-up growth is just a function of growth, and so when global/China GDP growth is slow, catch-up growth is less widespread. But this doesn’t explain why catch-up growth has faded so sharply in the last couple of years: while both global growth and trade volumes are not doing that great, they also have not gotten suddenly worse. What has declined very sharply are commodity prices, thanks to an oversupply generated by producers who thought China’s housing construction boom would go on longer than it actually did. So I think commodities may be more important for the pattern of emerging-market catch-up growth than the World Bank acknowledges.

This does not mean that I’m arguing commodity exports are actually a great thing and that it’s really too bad that commodity prices have fallen. I firmly agree with the conventional wisdom that commodity exports are not an effective or sustainable way for developing countries to become rich. But remember what is being measured in these lovely charts: not the number of people whose incomes are converging with developed-country standards, but the number of countries (basically a diffusion index). And my intuition would be that more developing countries are, if only by default, commodity exporters, simply because the alternative development model–exporting manufactured goods–is in fact quite hard to do.

The data support this intuition. If I split developing countries into two baskets, manufactures exporters and commodity exporters, on the simple criterion of having more or less than half their exports in manufactured goods (a concept I borrowed from Jon Anderson), the majority of developing countries are in fact commodity exporters. For the low and middle-income countries in the World Bank’s World Development Indicators database, only 33 of 96 countries had more than 50% of their exports in manufactured goods in 2011. The same pattern holds internally within China: while most of China’s population is concentrated along the coast, most of its provinces are not. Of China’s 31 provinces, only 10 are officially classified as “Eastern.” The diffusion index for catch-up growth within China will therefore be dominated by the central and western provinces, and these provinces have more commodity-driven economies. To be precise, I estimate that the mining and metals share of GDP is higher than the national average in all but four of the 21 central and western provinces.

This pattern of catch-up growth is not just a statistical artifact, but gets at a real phenomenon. The same economic role has been played by a group of provinces within China’s borders, and a large group of countries outside China’s borders. Both prospered by supplying materials for China’s housing boom (the underlying cause of the commodity boom), and both are seeing that prosperity erode now that the housing boom is fading. I keep discovering that housing is the answer to many economic questions about China; it seems that Chinese housing also explains a lot about the patterns of global growth.

Freeing up China’s service sector: the why and the how

I have a new paper out at the Paulson Institute, on China’s service sector. Obviously I would like people to read the whole thing, but here’s the short version:

The first part of the paper is a rather fun (for me anyway) piece of data work, comparing the development of China’s service sector over time with the patterns of Japan, South Korea, and Taiwan. The conclusion is that China’s “modern” service sector looks over-developed, while its household service sector looks under-developed. The over-development of modern services seems to caused mainly by a huge increase in the size of the financial sector, and therefore is not actually a cause for celebration. The under-development of household services suggests (though admittedly does not prove) that these sectors are being held back by high levels of state ownership and/or regulation. Therefore I argue that instead of doubling down on finance-driven growth, China would be better off liberalizing household and other service sectors.

In the second part I offer some suggestions on how to do this. My main idea is that China should make use of its well-developed planning institutions to drive liberalization. In simple terms, I propose that the Chinese government set quantitative targets for the market share of private companies in various sectors. This would make clear what the end goal of liberalization is, and impose accountability on officials for achieving that end goal–but it would also allow for flexibility in how the goal is reached. There is some precedent for this approach: in the twelfth five-year plan for the healthcare sector, the government set a target that private hospitals should account for 20% of hospital beds and service volume by 2015, and their market share did rise. Similar targets could work in other sectors. It’s worth a try, I think.

My thanks to Evan Feigenbaum and particularly Song Houze of the Paulson Institute for their help and comments on this paper, and I am also very pleased that the Institute’s resources allow the paper to be translated into Chinese.

Paulson-Services-Cover

Inertia is not helping China’s inland provinces

There is an interesting new Federal Reserve paper by Ryan Monarch that looks at some very detailed data on the relationships between US companies and their Chinese suppliers. The main finding is what he calls the inertia in these relationships: US importers tend to be reluctant to change Chinese suppliers, even to get a lower price. And when they do change suppliers, they often go to one that is located not very far from the old one. Here’s the key graphic and the author’s summary:

monarch-importers-fig1

Two facts are clear from Figure 1. First, there is a significant share of U.S. importers who maintain the same supplier over time. Even though the number of potential exporting choices is increasing over this time period, the share of importers using the same supplier year-to-year is 45.9%. As a benchmark, given that there are an average of 30 Chinese exporters to the U.S. per HS10 product in the data, if importers were choosing their partners randomly each year, the probability of staying would be 1/30, or 3%. Thus path dependence is far higher than would be expected if importers were choosing their supplier randomly. Secondly, among those firms who do choose to switch, approximately one-third of all importers remain in the same city as their original supplier. Using a similar benchmark as above, random exporter selection would imply a 12-13% chance of staying in the same city. Thus there is strong inertia keeping firms in their original city, even if they choose not to use the same supplier as before.

Much of the rest of the paper is about how making it easier for US companies to find trusted new suppliers could lower import prices. I’m more interested in a different angle: what this importer inertia means for the Chinese suppliers and for regional development within China.

Chinese exporters are clustered in the coastal provinces, and for years people have been talking about how rising labor costs in those provinces will push manufacturing inland. The government has embraced this putative trend as a development strategy, building up infrastructure in the inland provinces to lower transport costs and actively encouraging relocation (see for instance this good Reuters piece on the drive to develop textile manufacturing in Xinjiang). Yet despite conventional wisdom and government policy, the inland provinces’ share of Chinese exports is only marginally higher than it was a decade ago.

coast-vs-inland-export-share

Inertia helps explain why: existing trade relationships, concentrated in the coastal provinces, change only slowly, and when they do change the geographic shift is likely to be close. The need to maintain customer relationships is thus likely another reason for why manufacturers in the coastal provinces are not in fact so terribly eager to relocate inland. Here is a good observation from a recent Bloomberg article on Guangdong:

By moving elsewhere in China, factories may be able to trim wage bills or gain access to cheaper land, but they lose the concentration of suppliers, logistics and services that Guangdong has built up over 30 years. Gao Dapeng, CEO of Desay SV Automotive Co., which makes car navigation systems in Huizhou, said the overall cost saving of moving to an inland province like Chongqing is only about 10 percent, and it would mean the plant would be hundreds of miles from its suppliers. He said the company is not sure if the relocation is worth that.

It seems like the network effects and economies of scale and scope that China’s coastal provinces have developed are fairly powerful advantages, against which the cheaper labor and cheaper land in inland provinces are not proving as attractive as expected. Or to put it a different way, the cost of switching suppliers remains high, despite policies aimed at reducing it. The same issue could be affecting the lower-wage Asian economies who have been trying to grab export market share from China–which they have, but not as much as some economists expected, as Mark Magnier reports in the WSJ.

Saving labor isn’t everything: charts on capital in China

The excellent Scholar’s Stage blog reminded me to go through the Asian Productivity Organization’s latest  APO Productivity Databook, a feast of growth accounting data that has been sitting in my to-read pile for a while now. While I also like the consumption chart that Greer chose, my own favorite chart from the report is below; it’s pretty striking.

APO-labor-capital-price

While it’s possible there are some data problems in their estimation (that’s a pretty steep hockey stick), the direction of the trend is quite plausible. There is plenty of anecdotal evidence that the incentive to substitute capital for labor in China has been quite strong recently. And the government is not shy about using subsidies and other industrial policy to push things even further in that direction. Here is a recent piece from the FT:

Across the manufacturing belt that hugs China’s southern coastline, thousands of factories like Chen’s are turning to automation in a government-backed, robot-driven industrial revolution the likes of which the world has never seen. Since 2013, China has bought more industrial robots each year than any other country, including high-tech manufacturing giants such as Germany, Japan and South Korea. By the end of this year, China will overtake Japan to be the world’s biggest operator of industrial robots, according to the International Federation of Robotics (IFR), an industry lobby group. The pace of disruption in China is “unique in the history of robots,” says Gudrun Litzenberger, general secretary of the IFR.

Yet over the exact period during which it became much more compelling for companies to invest in capital rather than labor, overall investment spending in China nonetheless slowed substantially. The chart below is my estimate of real growth in capital formation in the national accounts (a better if less timely indicator than the monthly fixed-asset investment numbers). Gross investment growth was about 5% in 2015, against an average of 15% over the previous decade.

capex-slowdown

What’s going on here? How can investment growth be so weak when the incentive to substitute capital for labor is so strong? As for almost all macro questions about China, housing is a big part of the answer (a theme I have hammered on before; see this rant and this more sober post). Residential construction drove a big chunk of that 15% annual growth in the past, but housing now looks like it has moved off the steep part of the S-curve and on to the flatter part. With residential construction stalling out, it’s hard for aggregate investment to grow very fast. It will take a while for robots to compensate for that.

Why is China not a “transition economy”?

When I first started working on the Chinese economy, most of the research I read compared China to other Asian economies, particularly the “miracle” economies of Japan, South Korea and Taiwan. Grouping these economies together, despite their differences, is fairly easily justified by their exceptionally high growth performance over a long period of time.

But if we think back to the late 1970s and early 1980s, before China had that growth track record, it was not at all obvious that it belonged in the club. South Korea, Japan and the US were allied with the US, and China was, despite its feud with the Soviet Union, still very much part of the international socialist community. The term “transition economies” now conventionally refers only to Eastern Europe and former Soviet Union, and so leaves out by the far biggest example of an economy in transition away from central planning. So how exactly did China end up in the Asian growth miracle club, rather than the transition economy club? Some recent reading has helped me to understand this history better.
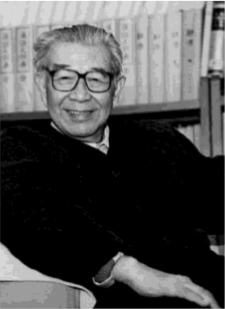
Yu Guangyuan

Yu Guangyuan

The examples of other socialist countries were in fact of great interest in China for a time. In the early years of the reform era, from roughly 1978 to 1985, there was a strong emphasis on establishing that economic reforms were ideologically consistent with socialism. One of the key figures in this effort was Yu Guangyuan, a Marxist theoretician/economist associated with Deng Xiaoping (he passed away in 2013). Yu presented China as one of several socialist countries in the world, all of whom had borrowed the Stalinist system from the USSR, all of whom had encountered problems in applying it to their own conditions, and all of whom were all trying to reform the socialist model. Hungary had had its “Goulash Communism” and Yugoslavia its “workers’ self-management” for years already. This rhetorical strategy emphasized how China was part of the global socialist movement, and how it risked falling behind even smaller socialist countries who were reforming.

Here is Yu on how the example of the Eastern European countries played an important role in early thinking about economic reform, from the preface to a recent anthology of his works:

After World War II, the Communist League of Yugoslavia seized power and proclaimed Yugoslavia a socialist country. Later, the League had differences with Joseph Stalin and was expelled from the socialist camp. Accordingly, the Communist Party of China also refused to recognize Yugoslavia as a socialist country and suspended its relations with the Communist League of Yugoslavia. In the 1950s and 1960s when the Chinese and Soviet parties were engaged in a polemic, we still regarded Yugoslavia as a negative example.

In 1978, a delegation of the Party Central Committee visited Yugoslavia. The delegation was headed by Li Yimang, with me and Qiao Shi being his deputies. Our mission was to conduct field inspections and contacts and then submit a report to the Party Central Committee on the basic conditions of that country and on whether interparty relations should be resumed. Before that, I had contacted some economists from the Soviet Union and Eastern European countries for their views on reform but never conducted any field inspection.

Yugoslavia’s practice left a deep impression on us. From this inspection, we drew a conclusion that socialist countries could have diverse economic models. The delegation submitted a report to the Party Central Committee after the visit. The report held that Stalin tried to impose the Soviet economic system and model on Yugoslavia but Joseph Tito rejected them, which led to a deterioration of the Soviet-Yugolsav relations, and that Yugoslavia was a socialist country and the Communist League of Yugoslavia was a party upholding socialism. Based on this report, the Party Central Committee decided to recognize Yugoslavia as a socialist country and to resume its relations with the Communist League of Yugoslavia. This meant that the Party Central Committee changed its views on the diversity of socialist models…[which] represented an ideological shake-off of the party from the shackles of the Soviet model. …Nevertheless, many people indicated they could not accept the Yugoslav ‘autonomy’ system. In fact, our reform later did not follow that road.

…At the end of 1979, the Party Central Committee dispatched me to head a delegation to visit Hungary for a reform inspection. This inspection deepened our understanding that socialism could have diverse models, and enabled us to have more understanding of many concrete issues in the course of reform.

Yu also sponsored much of the early wave of research into the ideas of Mikhail Bukharin, the theorist behind the mixed-economy model adopted in Russia in the 1920s under the label of the “New Economic Policy” (see this previous post for more). But it is nonetheless the case that once the reform drive got beyond broad political conceptions and into practicalities, China took relatively little from the examples of Hungary, Yugoslavia, Poland and the USSR itself. Rather than restricting itself to models drawn from the international socialist brotherhood, China started looking to countries that were politically more distant but geographically closer.

One of the turning points in this shift is generally held to be the Moganshan conference of August 1982, organized with assistance from the World Bank. Edwin Lim, an early World Bank official in China, recalled the result in a 2005 account (source here):

Other than Adrian Wood and myself, all the other international participants were East European practitioners in Soviet-type reforms, particularly price reforms. Two major conclusions came out of this conference. First was that price reforms of the type attempted in the Soviet Union and Eastern Europe—more price adjustments than fundamental reforms of price-setting mechanisms—were not seen as true reforms. China thus began to look beyond the Soviet Union and Eastern Europe for its reform strategy. By the end of the decade, China was far ahead of the Soviet Union in moving toward a market economy. Second was the consensus among both international and Chinese participants that China simply did not have the margin of error to consider rapid reforms or shock therapy.

Another famous meeting of economists in 1985 helped cement the shift. Again from Lim:

Three years later, following the publication of the second Bank economic report, the question the reformists faced was how to manage a market economy and, particularly, the transition to it from a command economy. To address that question, we organized what has become known in China as the Bashan Boat Conference. The premier attached a great deal of importance to this conference and wanted many of the senior economic policymakers to participate. To ensure their complete attention, the conference was held on a boat (the Bashan) that floated slowly down the Yangtze River through the Three Gorges for seven days. Spouses of the international participants were invited, and each day the boat would dock to allow them to go sightseeing while the conference continued.

The foreign participants to this conference, in addition to Adrian Wood and myself, included Jim Tobin, the Nobel Laureate from Yale, who explained the basic principles of macro-management in a market economy; Sir Alec Cairncross of Oxford, who talked about management of a market economy, particularly the postwar experience of the United Kingdom in dismantling the wartime price control and rationing systems; Otmar Eminger, former president of the Bundesbank, who talked about the role of an independent central bank in macro-management as well as the German experience in dismantling the wartime control economy; Michel Albert, former head of the French planning commission, who talked about indicative planning in a market economy; and Janos Kornai of Hungary, who talked about behavior of a planned economy that may persist in a reformed scenario.

The decisive intervention may have been that of Janos Kornai, judging from how Ezra Vogel summarizes the result:

By the end of the conference, Chinese participants, already doubtful about the appropriateness of Eastern European models for China, were thoroughly convinced that the structural problems in socialist economies—such as the “soft budget constraints” that permitted firms to survive even with low performance and cycles of overproduction—were systemic problems in planning systems. This marked the end of the use of Eastern European reform models and greater acceptance of the role of markets.

If the fellow travelers in Eastern Europe did not have the answers, who did? There were some strong contenders not far away. Here is Vogel again (both quotes are from his Deng Xiaoping and the Transformation of China):

In the early 1980s, while Chinese leaders were exploring the experiences of Eastern Europe and making use of World Bank advisers, they were also studying Japanese experiences. Although Japan was a member of World Bank, Japanese efforts to work with China were generally done bilaterally and were conducted on a larger scale than China’s relations with any other country. Although China was also interested in the Taiwan and South Korea experiences in modernization, mainland China did not have direct relations with them until the late 1980s so their experiences in the early 1980s did not play a major role in shaping Chinese views. …

In the 1980s, Japanese gave more aid and built more industrial plants in China than did citizens from any other country. The Japanese factories built in China set standards by which China measured its progress in achieving efficient industrial production. For the study of modern science, the Chinese looked overwhelmingly to the United States. But more new machinery to build assembly lines in Chinese factories came from Japan than from anywhere else. Prime Minister Ikeda’s income-doubling plan for the 1960s became the inspiration for Deng’s goal of quadrupling the gross value of industrial and agricultural output in the 1980s and 1990s. And from 1974 on, Deng met more delegations from Japan than from any other nation.

By 1985, the idea that China would join the ranks of fast-growing East Asian countries was no longer ludicrous, though not exactly widely accepted. The Harvard economist Dwight Perkins was one of the first to posit that China would follow the high-growth East Asian path and not the less exciting example of the European transition economies. The following passage is from his 1986 book China: Asia’s Next Economic Giant? (note the question mark! a sign of the times):

Reform in the Chinese case means moving closer to at least certain key features of the economic strategy and economic system found elsewhere in East Asia. In concrete terms that means retaining an emphasis on an expanding role for foreign trade, household-based agriculture operating in response to market forces, and a substantially enhanced role for the market in industry subject to continued state guidance but not direct control. … Hungary and Yugoslavia, for example, have achieved reforms in their economic systems that go well beyond those currently in force in China in many respects, but no one contemplates 6 to 8 percent growth rates in GNP in those countries over the next decade or two. … Japan, South Korea, Taiwan and other others have demonstrated that GNP growth rates of 8 percent a year and even higher are feasible in the post-World War II era. In terms of per capita income, level of capital formation, and degree of income inequality China has characteristics similar to those of its East Asian neighbors when they entered into sustained periods of rapid growth.

Ultimately, the reason why China favored Asian over East European models was most likely that those models were more relevant to its conditions on the ground. Despite the political affinity with other socialist states in Europe, China’s economic structure at the start of the reform era was quite different, and more similar to the other Asian economies at the beginning of their growth take-off processes. The classic statement of this argument is a 1994 article by Jeffrey Sachs and Wing Thye Woo, “Structural Factors in the Economic Reforms of China, Eastern Europe, and the Former Soviet Union,” (JSTOR link):

China began reform as a peasant agricultural society, EEFSU as urban and overindustrialized. China faced the classic problem of normal economic development, the transfer of workers from low-productivity agriculture to higher-productivity industry. In EEFSU, the problem is structural adjustment: cutting employment in inefficient and subsidized industry to allow new jobs in efficient industry and services. …Crucially, China’s agricultural workers had nothing to lose, indeed much to gain, from the dismantling of socialism, while much of the industrial and even agricultural work force in EEFSU has plausible fears that dismantling the old system could leave them worse off, at least in the short run.

These days, the differences between China and the other Asian “miracle” growth stories are becoming more apparent–the most important being the continued large role of state-owned enterprises in its economy (the best summary of those similarities and differences is the last chapter of Joe Studwell’s How Asia Works). I wonder if, in this context, comparisons of China to the European “transition economies” will soon start to seem more relevant.

The raw material of urbanization: recommended readings on steel

Fresh from posting on the winter of the steel industry in China, I see that Richard Jones has written a nice top-level view of the role of steel in the world economy, explaining broad indicators like per-capita steel demand, and steel intensity, or steel use per unit of GDP:

The dominant uses for steel now are in construction and infrastructure. 42% of steel output goes into buildings, the biggest fraction of which (44%) is in the form of rebar, and 14% in other infrastructure (again, mostly as rebar, but including some 6% as train tracks).

Steel, then, is the fundamental raw material of urbanisation. We can now understand the two periods of fast growth of steel output, in broad terms, as corresponding to two great waves of urbanisation–the first, between 1950 and 1980, in the USA and Europe, and the second, from 2000 and still continuing, as the rapid urbanisation of China. …

Steel is more important than ever as the foundation of our industrialised, urban economies. But more than a century of remarkable (and widely unappreciated) technological progress means that it is relatively less important in terms of its contribution to GDP, because we’ve learnt to make it so much more cheaply and efficiently.

But why exactly is steel the “fundamental raw material of urbanization”? To understand this we have to understand something of the history and physical properties of steel. I also recently stumbled across this nice account of the invention of the modern process of steelmaking in the American Scientist which explains the basics well:

Broadly speaking, steel is just iron with a bit of carbon in it. But that definition doesn’t capture the stunning metamorphosis that occurs when the iron and carbon merge in the correct way. The secret behind steel is that it isn’t just one substance like most metals, but a mixture. On the microscopic scale, steel turns into two different substances that stack up like a layer cake. One of the layers is rich in carbon and strong. This layer is a chemical compound called cementite, and with the right amount of force, it snaps like brittle chalk. The other layer has little carbon (around 0.2 percent) and is malleable (flexible and easily bent). This chemical compound is called ferrite, and with enough force, it can be pulled like taffy. These layers complement each other with strength and malleability. Most metals, being monolithic, have only one property or the other. The characteristics of strength and malleability usually are more like two ends of a seesaw; as one goes up, the other goes down. But in steel, its layers allow both properties to exist, and that makes steel versatile and suitable to build many things, from trains to tools to cars to cans.

So steel is useful for many things, but why is it particularly useful for buildings? I did not fully grasp this until I read Mark Miodownik’s wonderful book Stuff Matters: Exploring the Marvelous Materials That Shape Our Man-Made World. A delightful introduction to materials science, it includes chapters on both steel and concrete. And it turns out that steel by itself is not the “fundamental raw material of urbanization”; that title should properly belong to steel-reinforced concrete. The unusual interaction between the physical properties of concrete and steel makes this an incredibly useful combination:

Concrete is essentially a simulacrum of stone: it is derived from it and is similar in appearance, composition, and properties. Concrete reinforced with steel is fundamentally different: there is no naturally occurring material like it. When concrete reinforced with steel comes under bending stresses, the inner skeleton of steel soaks up the stress and protects it from the formation of large cracks. It is two materials in one, and it transforms concrete from a specialist material to the most multipurpose building material of all time. …

Most materials expand when they get warmer and contract when they get cooler. Our buildings, roads, and bridges expand and contract like this, observing day and night temperature cycles, as if they are breathing. It is this expansion and contraction that causes a lot of the cracks in roads and buildings, and if it is not taken into account in their design, then the stresses that build up can destroy the structure. Any engineer…might have assumed that concrete and steel, being so different, would expand and contract at such different rates that they would tear each other apart… But, as luck would have it, steel and concrete have almost identical coefficients of expansion. In other words, they expand and contract at almost the same rate. This is a minor miracle.

There’s a lot more fun stuff in all three of these readings.

Did Australia invent central bank transparency?

On a recent visit to Australia, I was told that the Reserve Bank of Australia was the first central bank to ever issue a press release announcing a change in monetary policy. That first statement came out on January 23, 1990, a full four years before the US Federal Reserve started announcing its own monetary policy decisions. I certainly did not know this fact before, and on reviewing standard accounts of the rise of central bank transparency, it appears that many other people may also not be aware of the RBA’s trailblazing. Here is one often-cited paper by Alan Blinder et al. from 2008:

Alan Greenspan, who once prided himself on “mumbling with great incoherence,” was by 2003 explicitly managing expectations by telling everyone that the Fed would keep the federal funds rate low “for a considerable period.” This guidance was only the latest step in what was, by then, a long march toward greater transparency that began in February 1994 when the Federal Open Market Committee (FOMC) first started announcing its decisions on the federal funds rate target. In May 1999, the FOMC began publishing an assessment of its “bias” with respect to future changes in monetary policy in its statements. It also began issuing fuller statements, even when it was not changing rates. About three years later, it began announcing FOMC votes—with names attached—immediately after each meeting. Starting in February 2005, the FOMC expedited the release of its minutes to make them available before the subsequent FOMC meeting. And most recently, starting in November 2007, the Fed has increased the frequency and expanded the content and horizon of its publicly-released forecasts.

Other central banks have also become remarkably more transparent in the last 10-15 years and are placing much greater weight on their communications. In fact, the Fed is more of a laggard than a leader in this regard. The Reserve Bank of New Zealand and the Bank of England were early and enthusiastic converts to greater transparency, and Norges Bank (the central bank of Norway) and Sveriges Riksbank (the central bank of Sweden) may now be in the vanguard. Arguably, the European Central Bank (ECB) has been more transparent than the Fed ever since it opened its doors in 1998.

Australia is not mentioned at all in this account, which seems rather unfair. The RBA is certainly not tooting its own horn; the bank’s own website merely states, in perfectly neutral central-bank-ese:

Since January 1990, each change to monetary policy has been announced in a media release, which sets out the change in the cash rate target and the reasons for it.

That first press release from 1990 is still preserved online. It is interesting to note that the press release was issued only a day after the decision was made, and after the RBA had already acted in the market to achieve its goal:

The Governor of the Reserve Bank (Mr Bernie Fraser) confirmed that the Bank had operated in the domestic money market this morning to bring about a modest reduction in interest rates.

The Reserve Bank Board, which reviewed the case for an easing in monetary policy at its November and December meetings, agreed at a meeting yesterday that it was appropriate to be making some adjustment now.

It is a bit challenging for me to verify whether the RBA’s statement was indeed the first in the world, but the claim certainly holds up to an initial examination–I can’t find any evidence online of an earlier monetary policy statement by the Bank of England or the Reserve Bank of New Zealand, the other early adopters of transparency. That of course doesn’t definitively mean that there wasn’t one, and I would welcome information and correction from those better informed. But the Australians were certainly very early getting onto the road that has led, more recently, to “forward guidance” and “dot plots.” Perhaps that is something they do not wish to brag about…

Update. A correspondent informs me that the Reserve Bank of New Zealand made its first public monetary policy statement in March 1990, a move that was required by 1989 legislation governing the central bank. The statement lays out the central bank’s goals for monetary policy, expressed in specific targets for the CPI, although it does not explicitly announce a change in monetary policy settings. This is because the RBNZ’s target rate for monetary policy, the official cash rate or OCR, was not yet in existence (it was introduced in 1999). But the statement is in other ways perhaps more transparent than the RBA’s, being clearer about the policy goals and more detailed in its economic analysis. The RBNZ statement was also required by law, while as best I can tell the RBA’s first statement was issued at the central bank’s own discretion. So the two early statements are not exactly the same thing; in any case, the RBA beat the RBNZ to the punch by two months or so. The Aussies have it, by a nose.

Unpacking the many consequences of China’s housing boom

Here is one of the best papers on the Chinese economy I’ve read in a long time–and I read a lot of papers on the Chinese economy. Currently in draft, “A Rebalancing Chinese Economy: Challenges and International Implications” is a systematic explanation of most of the big macro questions about China. The authors are Guonan Ma, an eminent Chinese economist recently retired from the BIS, and Ivan Roberts and Gerard Kelly of the Reserve Bank of Australia.

While there’s a lot to digest in this paper, for this post I want to pull out some of the thoughts about housing. I ranted a while back about how academic economists were ignoring the role of the housing market in driving economic developments in China. This paper by contrast puts housing front and center, and very effectively too. From the conclusion:

We find that conventional analysis understates the role of the household sector in contributing to the high investment share of the economy. Our explanation for the imbalances emphasises the role played by housing market deregulation as one of multiple prolonged positive productivity and demand shocks to the Chinese economy that simultaneously sustained returns to capital, lifted investment and boosted both private and public saving. While recent discussions stress the need to reform financial markets to foster rebalancing, we argue that rebalancing will probably happen anyway as a natural outcome of dwindling income windfalls from worsening demographics, fading positive productivity shocks and maturing housing markets, all of which helped drive the imbalances in the first place.

And some more details from the body of the piece:

The role played by the deregulation of housing markets in China deserves special emphasis. In 1988, the Chinese constitution was amended to legalise the transactions of land use rights, laying the foundation for private home ownership. Throughout the 1980s and 1990s, most of the housing provided by SOEs to their employees was privatised at a discount to the replacement cost. Mortgages were introduced in 1997, and official mortgage rates were cut five times during 1998-2002 to counter the negative consequences of the Asian Financial Crisis.

The deregulation of housing markets saw residential investment rise sharply starting in the early 2000s to almost 16% of GDP currently. This housing boom stimulated huge capacity-building in many related upstream and downstream industries, including steel, cement, glass, household appliances and financial services. Using data from the 2010 input-output tables and more up-to-date data on value-added, Xu et al (2015) estimate that, directly and indirectly, residential housing accounted for 29.4% of GDP growth in 2013.

It is likely that the housing boom simultaneously boosted growth, investment and saving in China while subtracting from net household income (through higher mortgage payments). The rise of private home ownership in the late 1990s boosted incentives to save by households strongly motivated to upgrade their housing and to build up private assets, while generating higher investment. As discussed, the rise in household investment mostly reflected individual investment in residential construction. The property investment booms in the 2000s further boosted land sales proceeds accruing to local Chinese governments, helping to fund investment in infrastructure. At the same time, the steady rise of mortgage loans as a share of total credit (reaching 12% in 2014) implied larger interest payments by home-buyers to financial institutions and a corresponding fall in households’ net property income. In turn, this contributed to the decline in the household share of income in the 1990s and 2000s.

The housing boom increased both sales volumes and prices, lifting corporate earnings and the return to capital across many related industries and helping to underpin strong corporate saving and investment until the late 2000s. In sum, the opening of the housing market can be viewed as a prolonged positive demand shock to the Chinese economy, sustaining returns to capital, boosting investment and lifting both private and public saving at the same time.

The paper is long and somewhat technical in parts, but also conceptually very clear, and the whole thing is very much worth reading. The draft was presented at the Reserve Bank of Australia’s annual conference last week; other draft papers from the conference have also been posted online.